by Heather Andrews | Jun 23, 2014 | Lockbox, Statistics
This Week’s Lockbox Activity
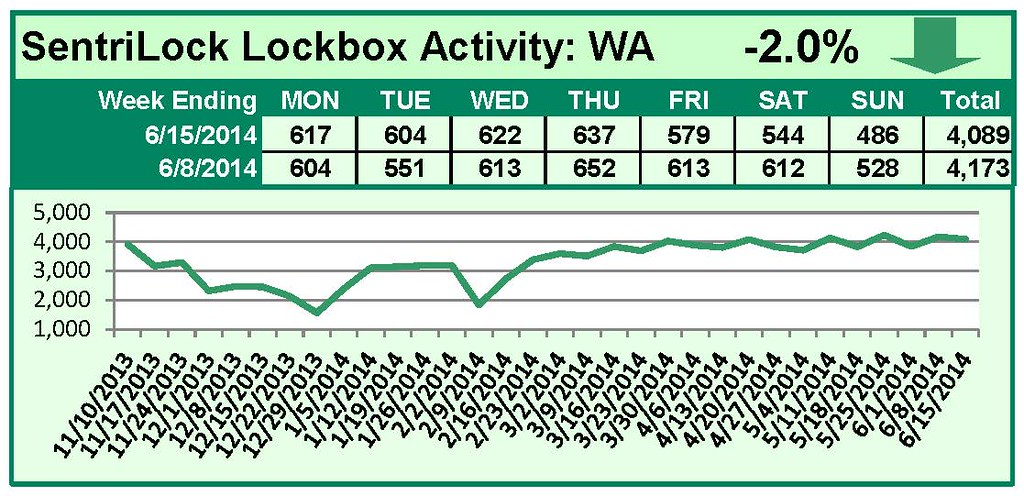
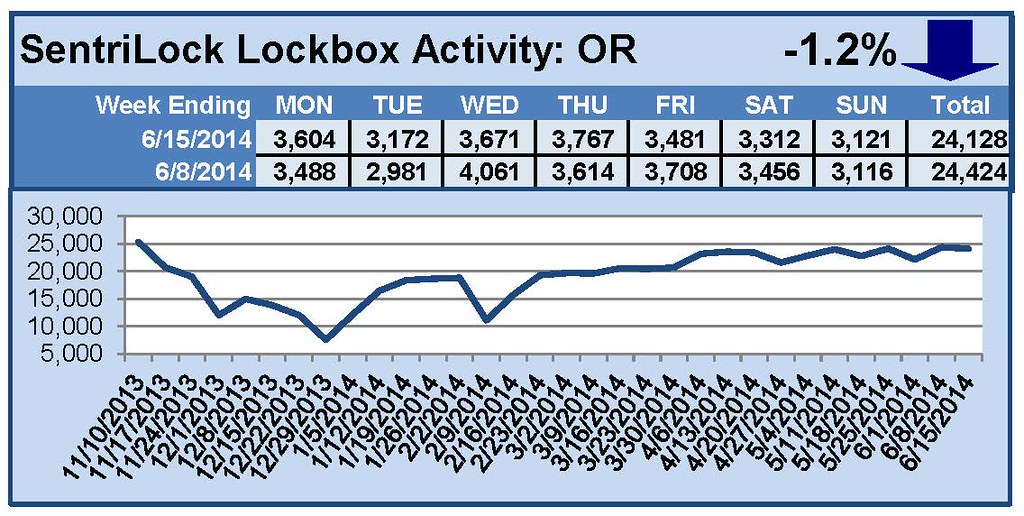
For the week of June 9-15, 2014, these charts show the number of times RMLS™ subscribers opened SentriLock lockboxes in Oregon and Washington. Activity fell in both Oregon and Washington this week.
For a larger version of each chart, visit the RMLS™ photostream on Flickr.
Please note: due to the RMLS™ transition to SentriLock, historical data is only currently available through the RMLS™ Flickr page, under the tag “Supra lockbox activity.” SentriLock data will continue accumulating until each chart represents a year of data.
by Heather Andrews | Jun 16, 2014 | Lockbox, Statistics
This Week’s Lockbox Activity
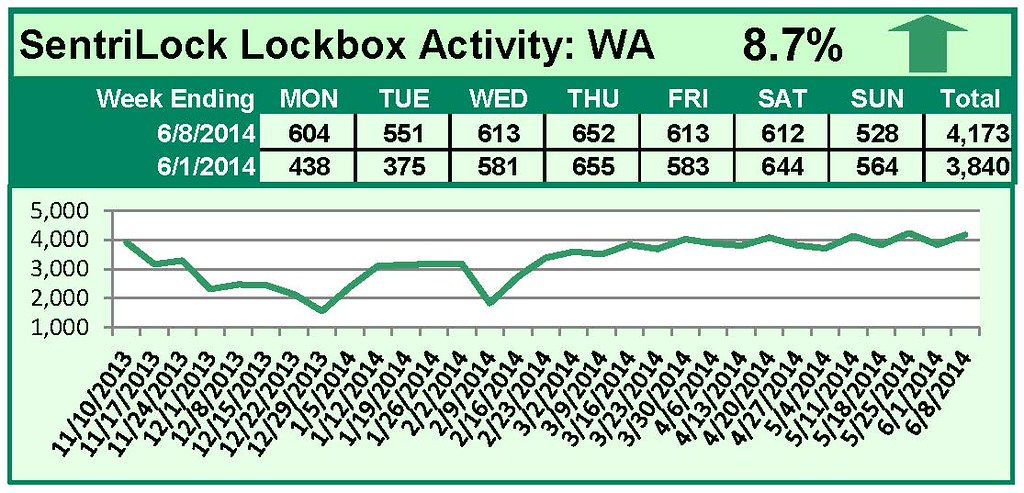
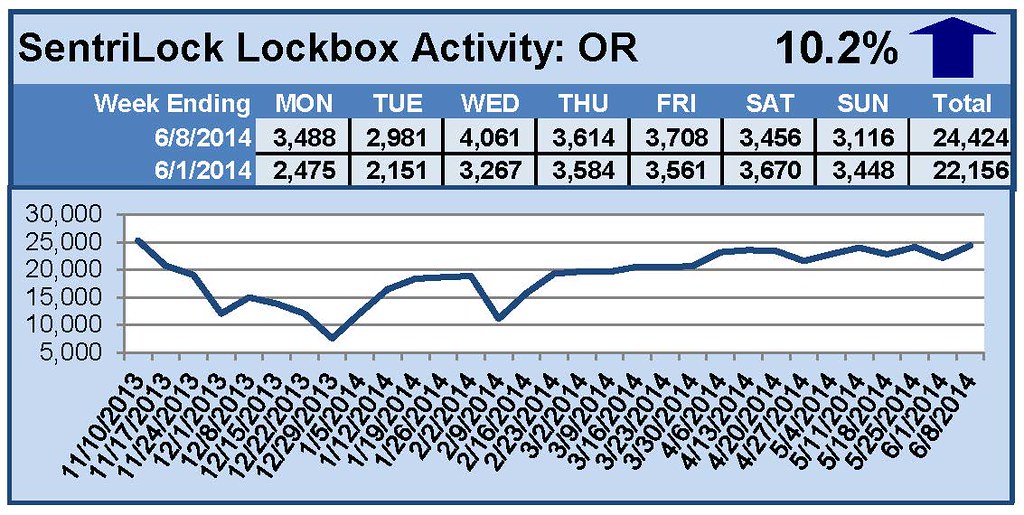
For the week of June 2-8, 2014, these charts show the number of times RMLS™ subscribers opened SentriLock lockboxes in Oregon and Washington. Showings rose this week in both states.
For a larger version of each chart, visit the RMLS™ photostream on Flickr.
Please note: due to the RMLS™ transition to SentriLock, historical data is only currently available through the RMLS™ Flickr page, under the tag “Supra lockbox activity.” SentriLock data will continue accumulating until each chart represents a year of data.
![How to Pull Your Own Distressed Properties Information on RMLSweb]()
by Heather Andrews | Jun 13, 2014 | Distressed Properties
RMLS™ knows just how popular our quarterly distressed properties infographics are. We often get an inquiry or two before the end of each quarter—and once they’re released, we hear from others looking for information for their part of the RMLS™ region, or sometimes a particular town inside a larger area.
Subscribers can pull their own data using RMLSweb for whatever county, city, ZIP, or area number they’d like. Here’s how.
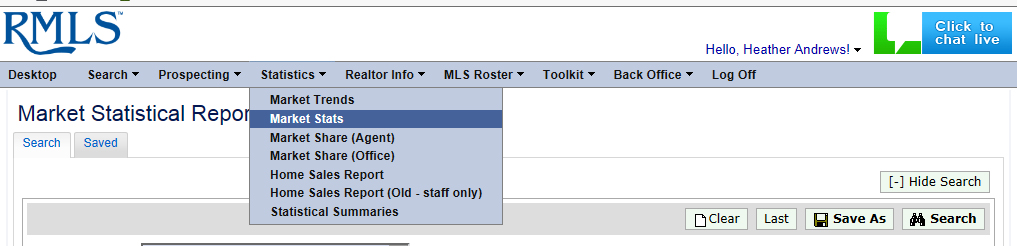
On RMLSweb, hover over the Statistics menu and select “Market Stats” (above). You’ll be running a total of six searches using this feature to recreate the information RMLS™ provides on our distressed infographics.
 SEARCH #1: Finding All Listed Properties
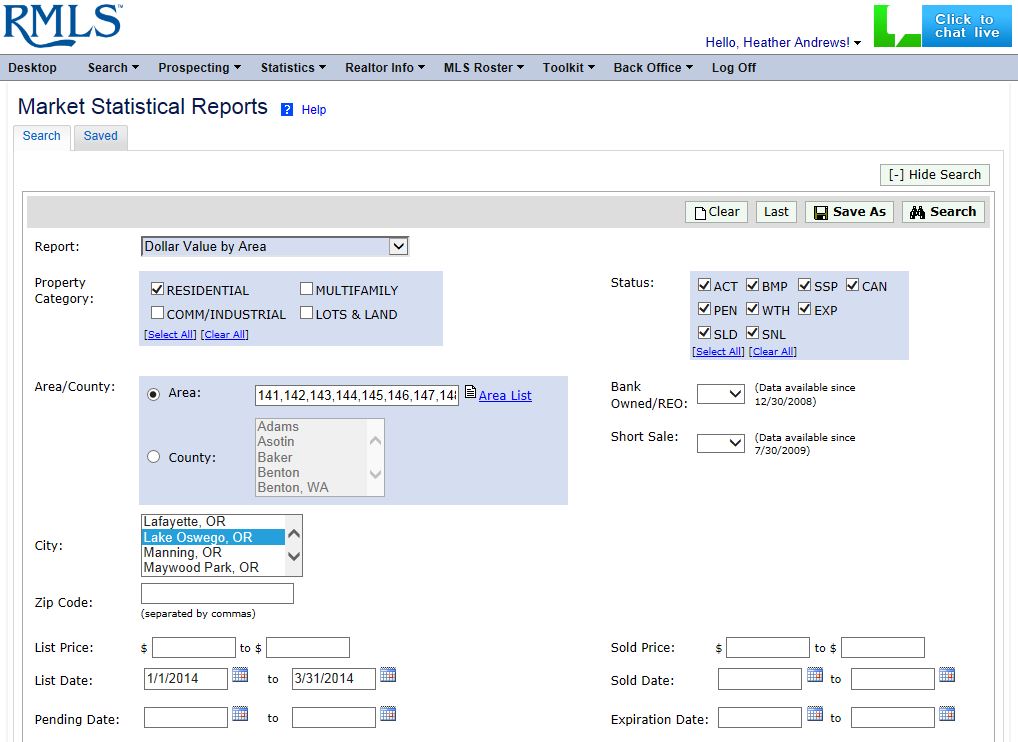
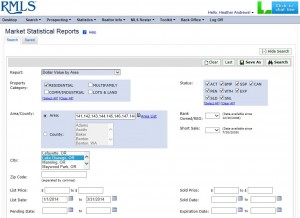
In the “Report” drop down menu, select “Dollar Value by Area.” Check whichever property categories you’re interested in finding (most subscribers will want “Residential”), and check all the statuses in the “Status” box.
Here’s where each search will be different depending on what you’re looking for. You can search using the area box (or type in a range, such as 145-148); select a county; select a city; or type in a ZIP code.
Narrow the search by typing dates into List Date. We generated first quarter data by asking for 1/1/2014 through 3/31/2014, but you might want to pull numbers for a different time frame.
Press on the Search button in the upper right of the window, and look at the summary row under “Total Props.” In our example (above), this gives you all properties listed in Lake Oswego during the first quarter of 2014.
SEARCH #2: Finding All Listed Short Sales
Follow the steps above, but check “Yes” on the Short Sale drop-down menu. Press on the Search button in the upper right of the window, and look at the summary row under “Total Props.” In our example, this gives you all short sale properties listed in Lake Oswego during the first quarter of 2014.
SEARCH #3: Finding All Listed Bank-Owned/REO Properties
Follow the steps in Search #1, but check “Yes” on the Bank Owned/REO drop-down menu. (If you did Search #2, don’t forget to clear out the Short Sale field!) Press on the Search button in the upper right of the window, and look at the summary row under “Total Props.” In our example, this gives you all Bank Owned/REO properties listed in Lake Oswego during the first quarter of 2014.

SEARCH #4: Finding All Sold Properties
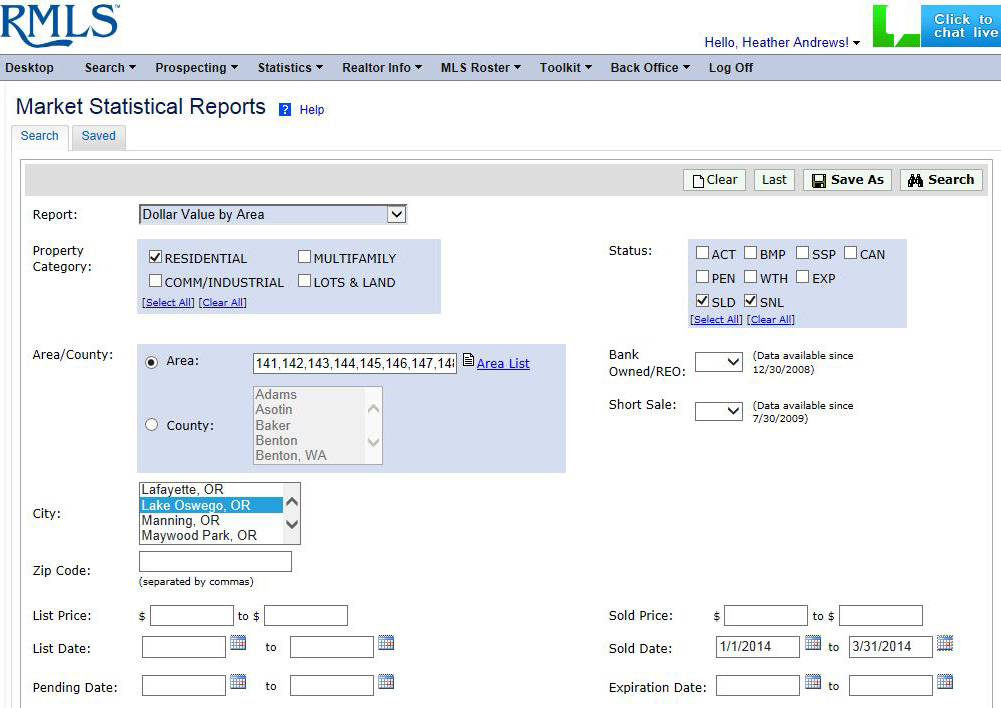
In the “Report” drop down menu, select “Dollar Value by Area.” Check whichever property categories you’re interested in finding (most subscribers will want “Residential”), and check SLD and SNL in the “Status” box.
Here’s where each search will be different depending on what you’re looking for. You can search using the area box (or type in a range, such as 145-148); select a county; select a city; or type in a ZIP code.
Narrow the search by typing dates into Sold Date. We generated first quarter data by asking for 1/1/2014 through 3/31/2014, but you might want to pull numbers for a different time frame.
Press on the Search button in the upper right of the window, and look at the summary row under “Total Props.” In our example (above), this gives you all properties sold in Lake Oswego during the first quarter of 2014.
SEARCH #5: Finding All Sold Short Sales
Follow the steps in Search #4, but check “Yes” on the Short Sale drop-down menu. Press on the Search button in the upper right of the window, and look at the summary row under “Total Props.” In our example, this gives you all short sale properties sold in Lake Oswego during the first quarter of 2014.
SEARCH #6: Finding All Sold Bank-Owned/REO Properties
Follow the steps in Search #4, but check “Yes” on the Bank Owned/REO drop-down menu. (If you did Search #5, don’t forget to clear out the Short Sale field!) Press on the Search button in the upper right of the window, and look at the summary row under “Total Props.” In our example, this gives you all Bank Owned/REO properties sold in Lake Oswego during the first quarter of 2014.
That’s it!
If you have access to graphics software, you can use your custom searches to develop graphics for distribution to clients. As always, all we ask is that you cite RMLS™ as the source of your data.
by Heather Andrews | Jun 9, 2014 | Lockbox, Statistics
This Week’s Lockbox Activity
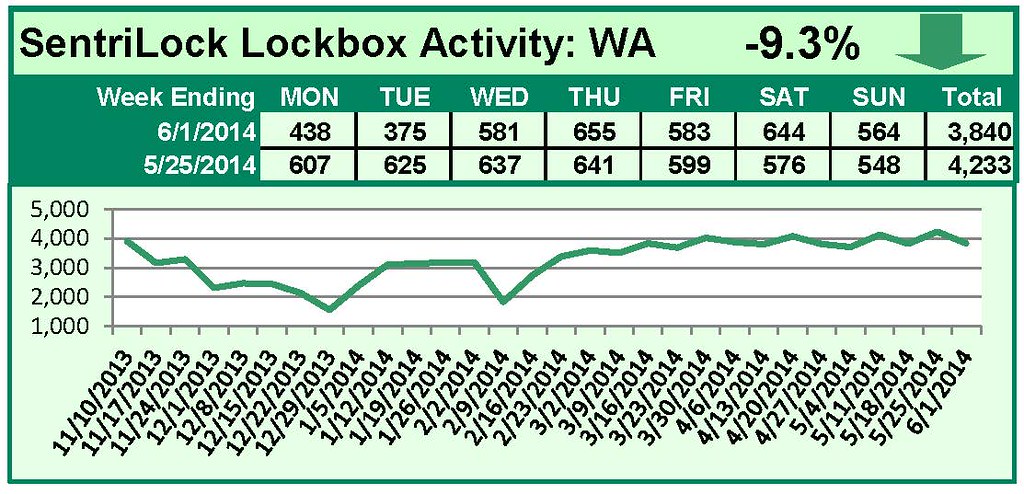
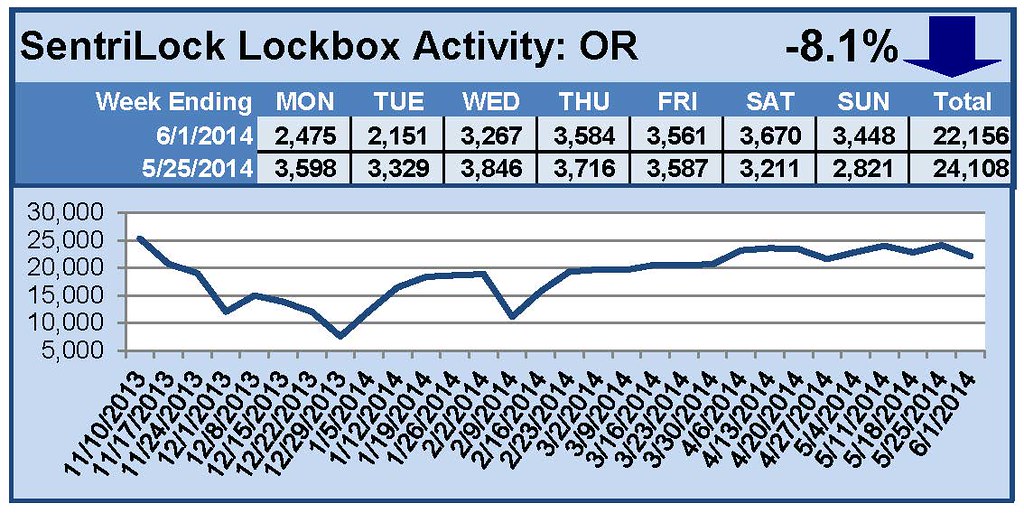
For the week of May 26-June 1, 2014, these charts show the number of times RMLS™ subscribers opened SentriLock lockboxes in Oregon and Washington. Activity fell this week in both states.
For a larger version of each chart, visit the RMLS™ photostream on Flickr.
Please note: due to the RMLS™ transition to SentriLock, historical data is only currently available through the RMLS™ Flickr page, under the tag “Supra lockbox activity.” SentriLock data will continue accumulating until each chart represents a year of data.
by Heather Andrews | Jun 4, 2014 | RMLSweb
Get ready—on Monday, June 9th, Find℠ will make its debut on RMLSweb!
Find℠ gives RMLS™ subscribers professionals-only access to data contained on REALTOR.com. Access is integrated within RMLSweb meaning it’s fast, flexible, and easy.
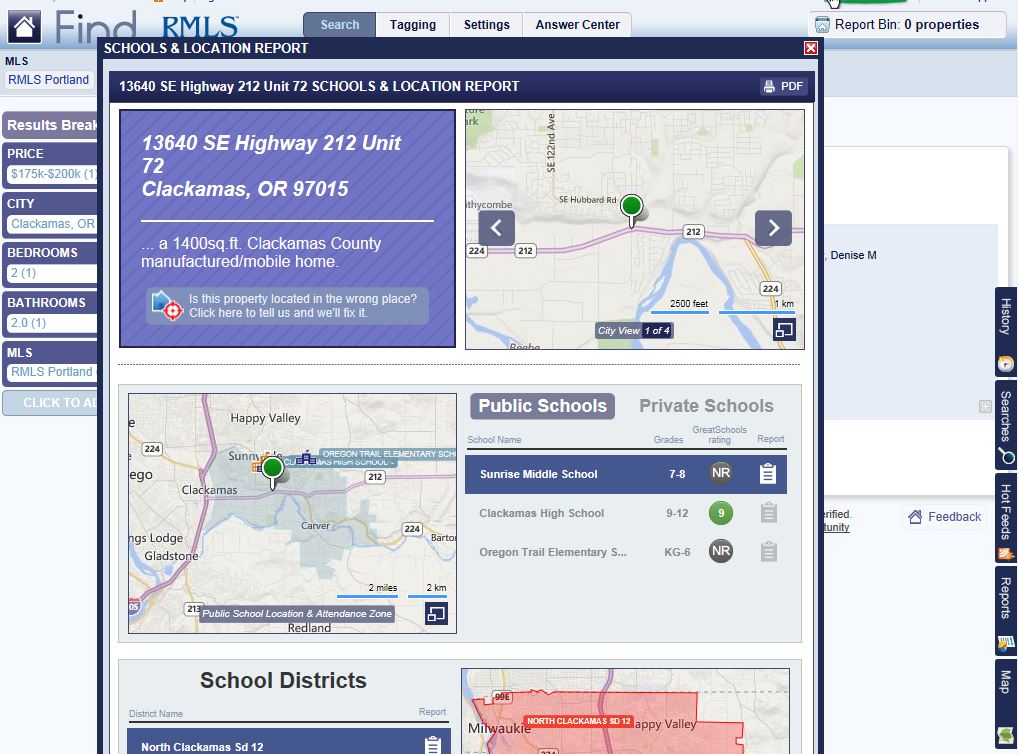
Using Find℠ to Find Property Details About an RMLSweb Listing
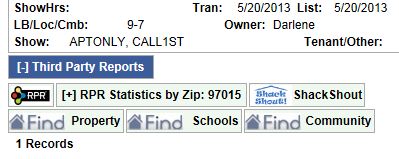
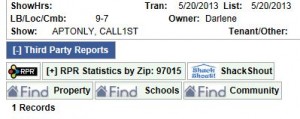
 In RMLSweb, click one of the Find℠ buttons (Property, Schools, or Community) at the bottom of an Agent Full or Data Only listing report to be taken to the selected report in Find℠.
 Closing that report will give you access to the full record for the listing, where you can quickly find map links, nearby comparables, information about local schools, an archive of listing photos, reports, and maps with layers such as flight patterns and nearby amenities.
Searching Find℠
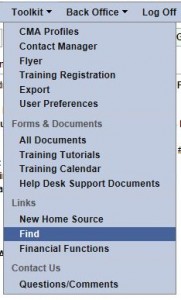 The other way to access Find℠ is via the Toolkit menu on RMLSweb, under “Links.”
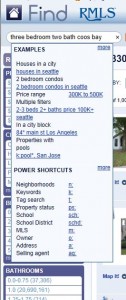
Searching via Find℠ is nearly as intuitive as Google. Simply type what you’re searching for into the search bar—Find℠ knows common REALTOR® shorthand and will classify the parts of your query into search fields when you press Enter. If you want to adjust your search, all fields can be changed by clicking to reveal a drop-down menu.
In instances where a term may be confusing or have multiple meanings, a box will appear to allow the user to specify what they’re looking for. As an example, searching for “granite” may refer to Granite City, CA, granite countertops, or houses on Granite Street. The box that will appear helps the agent search for just the right thing.
Find℠ gives RMLS™ subscribers the ability to search any property, whether it’s on the market or not. Find’s public records means you can access tax data and AVMs even on non-listed properties.
Helping clients relocate outside the RMLS™ region? Find℠ makes it easy to find a listing anywhere in the US—other MLSs belonging to Find℠ provide complete data, and MLSs not belonging to Find℠ still have the same basic consumer information available on REALTOR.com.
Check out a five-minute tour of Find℠:
https://www.youtube.com/watch?v=Ao68WCrJo0A
Thirsting for more information about how Find℠ can bring information to your fingertips in a flash? Check out the training button on the upper right corner. Regularly scheduled webinars cover the basics, mapping, and advanced capabilities of Find℠.
RMLS™ is proud to bring Find℠ to our subscribers, and hope you’ll find it to be a powerful tool that can help your business.