by RMLS Communication Department | Jan 22, 2010 | Industry News, Market Trends, Oregon Real Estate, Statistics, Washington Real Estate
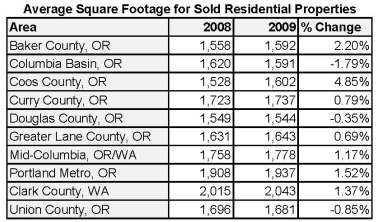
Average square footage of sold homes increases in most RMLS areas
There’s been a lot of talk lately about the size of homes being built and purchased getting smaller. The National Association of Home Builders reported that the “the average size of a new home that was completed in 2009 fell to 2,480 square feet from 2,520 square feet in 2008,” according to the Wall Street Journal. The median home purchase shrank from 1,825 square feet in 2008 to 1,800 square feet in 2009, according to the National Association of Realtors®.
I wanted to find out if the same would hold true in RMLS™ coverage areas, though, and here’s what I found:

As you can see, only three areas that we cover in Oregon & Washington dropped (Columbia Basin, Douglas County & Union County). In Portland it grew 1.52% and it was up 1.37% in Clark County. Coos County posted the largest increase at 4.85%.
I found our numbers a bit surprising. One school of thought is that the square footage would drop because first-time buyers have dominated the market in 2009, which you would think would mean smaller houses. That would make sense to me; I was a first-time buyer in 2009 and my house is 1,088 square feet.
On the other hand, what may have actually happened is that prices on homes with large square footage dropped so much that buyers have been snapping up more space for less money.
What do you think? Is the square footage of homes you’re working with shrinking? Are buyers more interested in smaller homes now? Or are they looking to grab more space while prices are low?

by RMLS Communication Department | Jan 20, 2010 | Guest Post, RMLSweb, Tips & Tricks
By Jasmine Ruthdotter, RMLS™ Project Manager
Most software companies have a way users can request changes or offer feedback about system usability. In RMLSweb, we ask subscribers to click on Toolkit and select Questions/Comments. But what exactly happens when you click our Submit button?

All requests are initially reviewed by a technician at our Help Desk. The primary reviewer asks themselves the following questions:
- Is immediate help needed?
- Is this a bug?
- Is this a change/enhancement?
If the answer to this last question is yes we add a ‘subscriber enhancement request’ to a spreadsheet for further review.
Remember that Schoolhouse Rocks, How a Bill Becomes Law cartoon? In it, the bill gets debated in committee. In RMLS™ requests are reviewed by our internal Enhancement Committee. Request frequency, level of complexity, and overall system impact are some items considered. 
Sometimes the request is passed along to RMLS™ Forms or Rules and Regulations committees. Sometimes they are passed along to the RMLS™ Board of Directors. Whatever the decision, we inform the requester of our next steps.
In the end some bills become law and some subscriber requests become features. When a green light is given, we add the request to our task tracking software and programmers begin coding. After the new feature is tested and materials are created to describe the change, it is released for our subscribers to use on RMLSweb.
How many features get released every year? We track what is released in document #1030 Deployment History and we outline future features in #1040 Future Enhancements.
So, if you find yourself thinking I wish the MLS could do this or wouldn’t it be nice if RMLSweb did that, scroll over Toolkit, click on Questions/Comments and start typing. We are here to respond.
Jasmine Ruthdotter works as Project Manager for RMLS™. She oversees reporting of cross-departmental projects for RMLS™ which includes Board of Director approved projects and internal projects that increase efficiency and improve productivity.

by RMLS Communication Department | Jan 18, 2010 | Lockbox, Oregon Real Estate, Statistics, Washington Real Estate
Numbers are up considerably in Oregon and Washington
When comparing the week of January 4 – January 10 with the week prior, the number of times an RMLS™ subscriber opened a Supra lockbox increased 45.8% in Washington and 67.5% in Oregon.
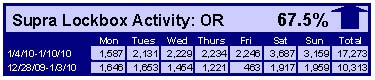

Click the chart for a larger view
Archive
View an archive of the Supra lockbox statistical reports on Flickr.

by RMLS Communication Department | Jan 15, 2010 | Lockbox, Supra
May was the busiest month in both Oregon and Washington
We’ve completed one full year of collecting and publishing lockbox activity information from Supra. To celebrate we compiled a couple of charts to show you how many Supra lockboxes were opened by RMLS™ agents each month in 2009.
Enjoy!


by RMLS Communication Department | Jan 14, 2010 | Baker County, Clark County, Coos County, Curry County, Lane County, Market Trends, Mid-Columbia, Oregon Real Estate, Portland, RMLS Market Action, Statistics, Union County, Washington Real Estate
Real estate activity in Oregon and SW Washington up in most RMLS areas
In the December 2009 RMLS™ Market Action report, sales activity was up in most areas that we cover, compared to December 2008. Though this is a positive sign, it should be taken with a grain of salt, because last December brought record lows for pending and closed sales in many areas.
Portland saw a 52.6% increase in closed sales this month and a 40.9% increase in pending listings, while Clark County closed sales were up 48.1%, and pending sales rose 33.8%. Baker County, Coos County, Curry County, Lane County, the Mid-Columbia region and Union County also saw both closed and pending sales increase over last December.
Sales volume down for the year in most areas

Given lower sales totals and lower prices, this should come as no surprise, but total sales volume for the year fell in most areas in 2009. Portland dropped from $6.3 billion in 2008 to $5.5 billion this year. Lane County was down from $740 million in 2008 to $669 million in 2009.
Notable, however, is an increase in sales volume in Curry County – up to $66 million this year from $59 million in 2008. And Clark County matched its total sales volume of $1.2 billion in 2008.
Year-end stats, Clark County shines
Clark County seems to be ahead of the pack when it comes to sales activity. For the year, pending sales were up 19.5% and closed sales up 13.8% compared to 2008. That’s far ahead of most areas; for example, in Portland, pending sales were up 4%, and closed sales were down 0.9%. Only Curry County outpaced Clark County in percentage of sales increase for 2009, with pending sales up 31.3% and closed sales up 23.7%.
However, the increase in sales has come at a price – Clark County saw the largest decrease (-12.6%) in median sale price for the 11 areas we cover.
