by RMLS Communication Department | Nov 14, 2016 | Lockbox, Statistics
This Week’s Lockbox Activity
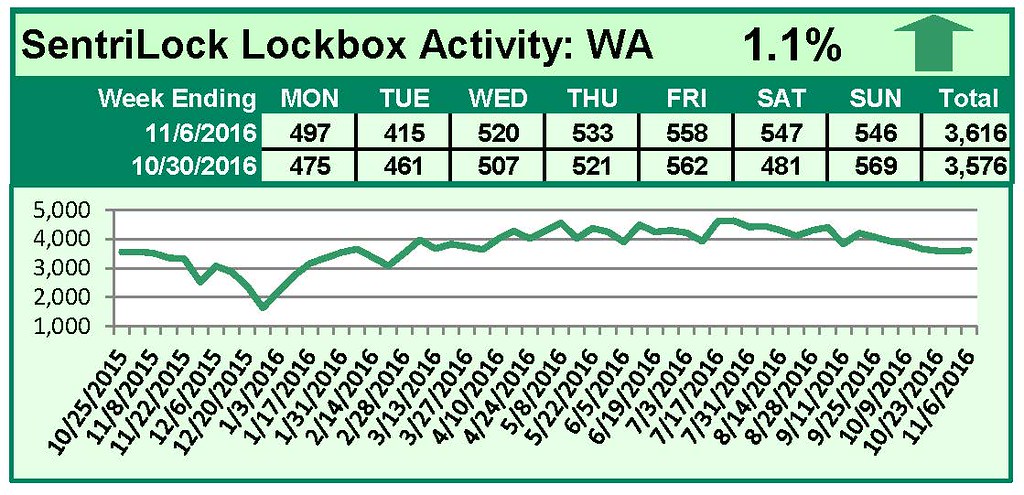
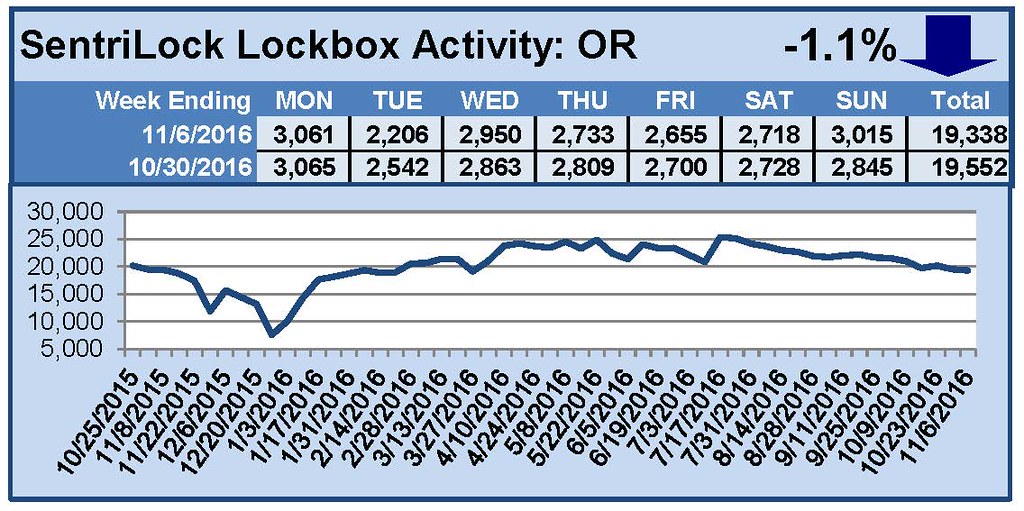
For the week of October 31-November 6, 2016, these charts show the number of times RMLS™ subscribers opened SentriLock lockboxes in Oregon and Washington. Activity increased in Washington and decreased in Oregon this week.
For a larger version of each chart, visit the RMLS™ photostream on Flickr.
![Mobile-friendly Menu Bar Coming to RMLSweb]()
by RMLS Communication Department | Nov 11, 2016 | RMLSweb

RMLS™ will soon be making a few changes to the menu bar on RMLSweb, making the site function better for mobile users. Subscribers should see the new look and feel as early as Tuesday, November 15th.
The new menu bar design on RMLSweb will be device-responsive—subscribers using mobile devices (and desktop users who decrease their browser width) will see the menu as icon on the left side of the page.

Touching the icon will expand the menu, at which point a user can then select the desired menu item from the stacked list.

Specific menu items won’t change, with one minor exception. The user name will be moved from above and made a menu item itself, under which subscribers can shortcut to User Preferences or log off.
RMLS™ knows how many real estate professionals access RMLSweb using their mobile device in the field. We’re happy to bring a feature to the site that should make this field access run more smoothly.
Questions? Subscribers can always contact the RMLS™ Help Desk at (503) 872-8002 or (877) 256-2169 about this or any other technical needs.
by RMLS Communication Department | Nov 7, 2016 | Lockbox, Statistics
This Week’s Lockbox Activity
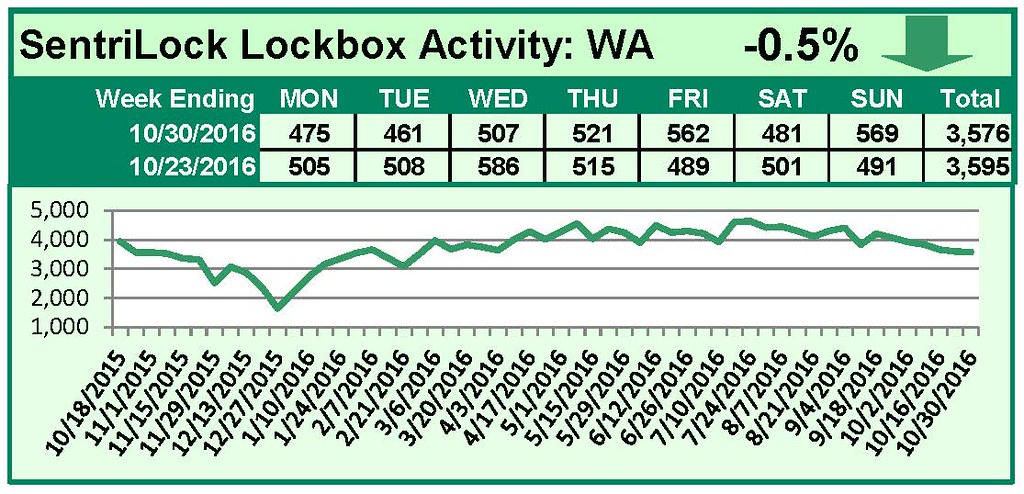
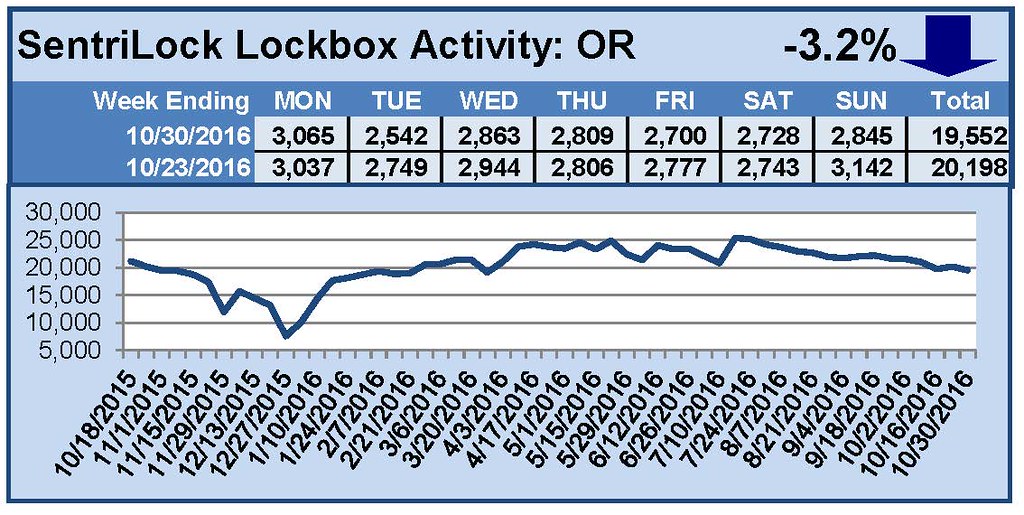
For the week of October 24-30, 2016, these charts show the number of times RMLS™ subscribers opened SentriLock lockboxes in Oregon and Washington. Activity decreased in both Oregon and Washington this week.
For a larger version of each chart, visit the RMLS™ photostream on Flickr.
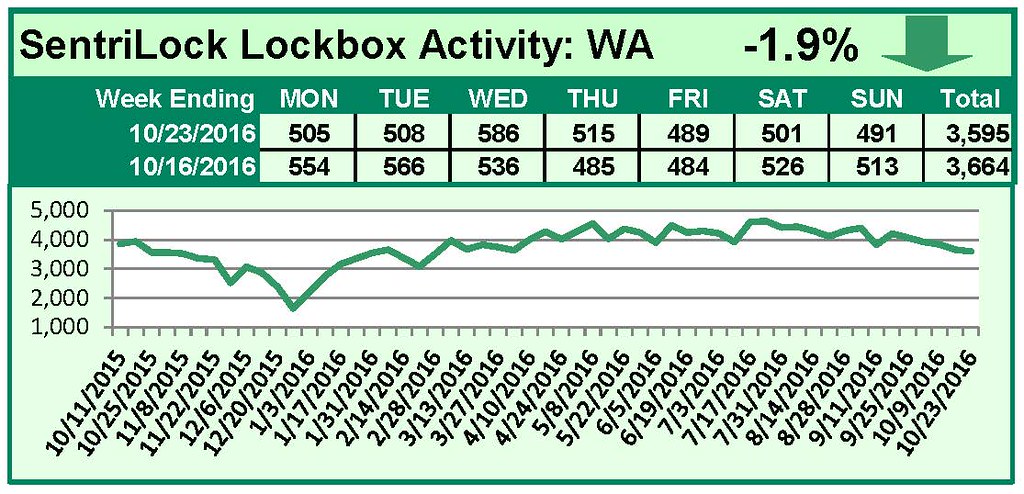
by RMLS Communication Department | Oct 31, 2016 | Lockbox, Statistics
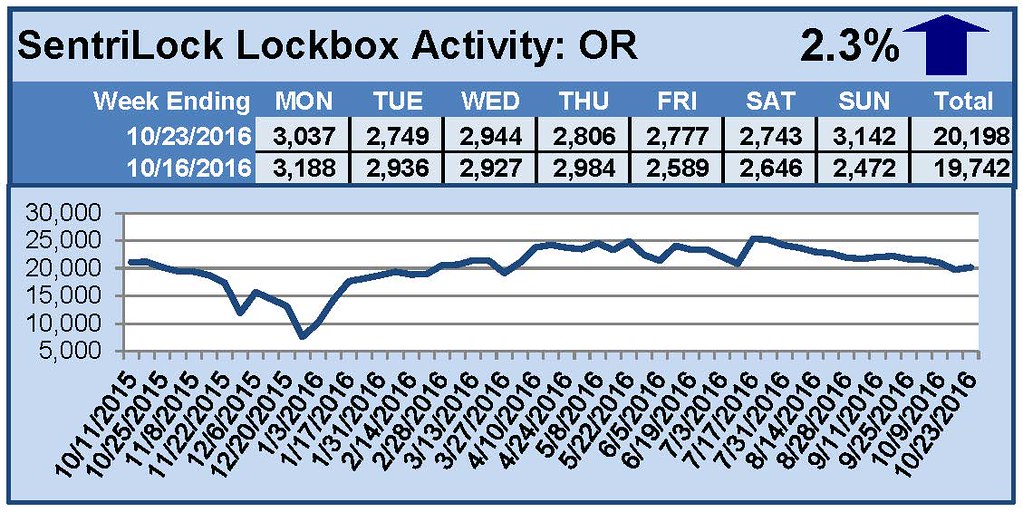
This Week’s Lockbox Activity
For the week of October 17-23, 2016, these charts show the number of times RMLS™ subscribers opened SentriLock lockboxes in Oregon and Washington. Activity increased in Oregon and decreased in Washington this week.
For a larger version of each chart, visit the RMLS™ photostream on Flickr.
![Mobile-friendly Menu Bar Coming to RMLSweb]()
by RMLS Communication Department | Oct 27, 2016 | Distressed Properties, Industry News, Market Trends, Statistics

This chart shows the number of bank owned/REO properties and short sales in all areas of the RMLS™ system during the third quarter of 2016.
Below are links to additional charts for some of our larger areas.
• Portland Metro Area Distressed Properties (3rd Quarter 2016)
• Clark County, WA Distressed Properties (3rd Quarter 2016)
• Lane County, OR Distressed Properties (3rd Quarter 2016)
• Douglas County, OR Distressed Properties (3rd Quarter 2016)
• Coos County, OR Distressed Properties (3rd Quarter 2016)
Here are some additional facts about distressed residential properties in the third quarter of 2016:
All areas when comparing percentage share of the market, third quarter to second quarter 2016:
• When comparing third quarter to second quarter 2016, distressed sales as a percentage of new listings decreased by 0.2% (3.9 v. 4.1%).
• In a comparison of third quarter to second quarter 2016, distressed sales as a percentage of closed sales decreased by 1.7% (5.1 v. 6.8%).
• Short sales comprised 0.7% of new listings and 1.0% of sales in the third quarter, down 0.1% and 0.3% from the second quarter of 2016, respectively.
• Bank owned/REO properties comprised 3.2% of new listings and 4.1% of sales in the third quarter, down 0.1% and 1.4% from the second quarter of 2016, respectively.
Portland metro when comparing percentage share of the market, third quarter to second quarter 2016:
• When comparing third quarter to second quarter 2016, distressed sales as a percentage of new listings decreased by 0.4% (2.9 v. 3.3%).
• In a comparison of third quarter to second quarter 2016, distressed sales as a percentage of closed sales increased by 0.9% (6.4 v. 5.5%).
• Short sales comprised 0.6% of new listings and 1.7% of sales in the third quarter, down 0.1% and up 0.5% from the second quarter of 2016, respectively.
• Bank owned/REO properties comprised 2.3% of new listings and 4.7% of sales in the third quarter, down 0.3% and up 0.4% from the second quarter of 2016, respectively.
Clark County when comparing percentage share of the market, third quarter to second quarter 2016:
• When comparing third quarter to second quarter 2016, distressed sales as a percentage of new listings decreased by 0.4% (2.8 v. 3.2%).
• In a comparison of third quarter to second quarter 2016, distressed sales as a percentage of closed sales decreased by 1.7% (3.5 v. 5.2%).
• Short sales comprised 1.3% of new listings and 1.0% of sales in the third quarter, unchanged for new listings and down 1.5% when compared to the second quarter of 2016, respectively.
• Bank owned/REO properties comprised 1.5% of new listings and 2.5% of sales in the third quarter, down 0.4% and 0.2% from the second quarter of 2016, respectively.
If you’d like more information or percentages of distressed residential sales in other areas not represented by our charts, please contact us at communications@rmls.com.