by RMLS Communication Department | Apr 25, 2016 | Lockbox, Statistics
This Week’s Lockbox Activity
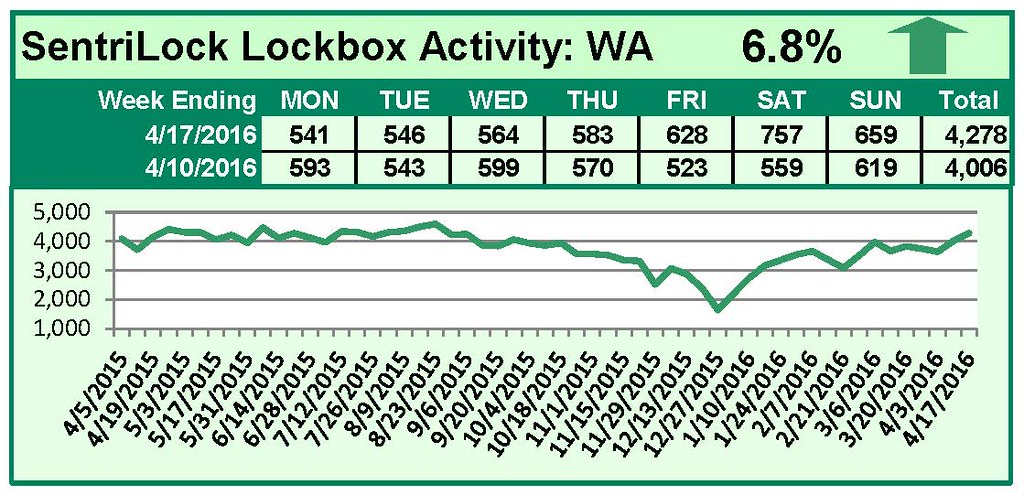
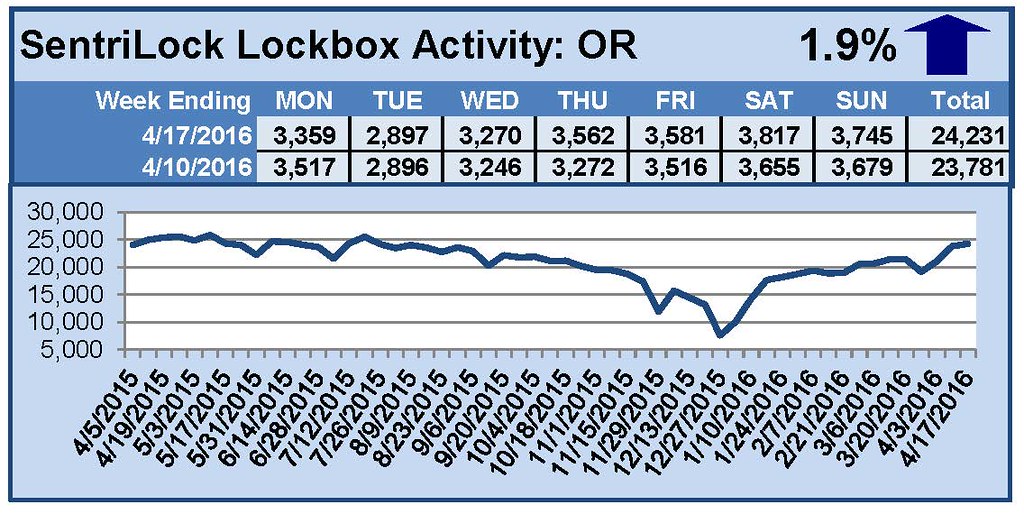
For the week of April 11-17, 2016, these charts show the number of times RMLS™ subscribers opened SentriLock lockboxes in Oregon and Washington. Activity rose in both Oregon and Washington this week.
For a larger version of each chart, visit the RMLS™ photostream on Flickr.
![New Home Source Professional Debuts Refreshed Site]()
by RMLS Communication Department | Apr 22, 2016 | Misc.

New Home Source Professional unveiled a site overhaul this week. The new site, which was the result of feedback from working REALTORS® across the country, introduces several new tools for RMLS™ members to find new homes and communicate with clients about them.
Here are five features worth checking out:

Multiple Search Options
On the refreshed New Home Source Professional site, filters and sorting have been improved. Select multiple cities, ZIP codes, or school districts. You can even search within a map! Users will have multiple search result options including list, map, or photo view, with quick previews.
Saved Listings, Saved Searches, Listing Reports
When you find new homes or communities that you like, save them! You can save the listings, save the search, or download and print PDF reports for each property.
Your Own New Home Website
Enhance your brand as a local new home expert with a branded consumer portal. This serves as both a way to communicate with clients and attract new buyers. Free!
Drive More Leads for Your Business
Potential home buyers can visit your consumer portal (free!), search new homes, then interact with you directly. Integrate it into your current website, email signature, and social media accounts to generate new clients.
Track All Client Activity
Which actions are your clients taking? You’ll know exactly what they’re doing on the site and can respond with timely, helpful communications. Net result? Efficient use of time for both you and your client, from initial engagement through a home purchase.
Sound exciting? Connect to New Home Source Professional via the link in the left-hand sidebar on RMLSweb or by navigating to Toolkit and clicking “New Home Source.” Search for a perfect new home for your client today!

![New Home Source Professional Debuts Refreshed Site]()
by RMLS Communication Department | Apr 20, 2016 | Distressed Properties, Industry News, Market Trends, Statistics

This chart shows the number of bank owned/REO properties and short sales in all areas of the RMLS™ system during the first quarter of 2016.
Below are links to additional charts for some of our larger areas.
• Portland Metro Area Distressed Properties (1st Quarter 2016)
• Clark County, WA Distressed Properties (1st Quarter 2016)
• Lane County, OR Distressed Properties (1st Quarter 2016)
• Douglas County, OR Distressed Properties (1st Quarter 2016)
• Coos County, OR Distressed Properties (1st Quarter 2016)
Here are some additional facts about distressed residential properties in the first quarter of 2016:
All areas when comparing percentage share of the market, first quarter 2016 to fourth quarter 2015:
• When comparing first quarter 2016 to fourth quarter 2015, distressed sales as a percentage of new listings decreased by 3.0% (7.1 v. 10.1%).
• In a comparison of first quarter 2016 to fourth quarter 2015, distressed sales as a percentage of closed sales decreased by 2.1% (10.6 v. 8.5%).
• Short sales comprised 1.5% of new listings and 1.9% of sales in the first quarter of 2016, down 0.7% and up 0.2% from the fourth quarter of 2015, respectively.
• Bank owned/REO properties comprised 5.6% of new listings and 8.7% of sales in the first quarter of 2016, down 2.3% and up 1.9% from the fourth quarter of 2015, respectively.
Portland metro when comparing percentage share of the market, first quarter 2016 to fourth quarter 2015:
• When comparing first quarter 2016 to fourth quarter 2015, distressed sales as a percentage of new listings decreased by 3.2% (6.0 v. 9.2%).
• In a comparison of first quarter 2016 to fourth quarter 2015, distressed sales as a percentage of closed sales increased by 1.9% (9.6 v. 7.7%).
• Short sales comprised 1.4% of new listings and 2.2% of sales in the first quarter of 2016, down 0.7% and up 0.4% from the fourth quarter of 2015, respectively.
• Bank owned/REO properties comprised 4.6% of new listings and 7.4% of sales in the first quarter of 2016, down 2.5% and up 1.5% from the fourth quarter of 2015, respectively.
Clark County when comparing percentage share of the market, first quarter 2016 to fourth quarter 2015:
• When comparing first quarter 2016 to fourth quarter 2015, distressed sales as a percentage of new listings decreased by 1.2% (5.8 v. 7.0%).
• In a comparison of first quarter 2016 to fourth quarter 2015, distressed sales as a percentage of closed sales remained unchanged (6.0 v. 6.0%).
• Short sales comprised 2.5% of new listings and 1.9% of sales in the first quarter of 2016, down 0.9% for new listings and exactly matching sales when compared to the fourth quarter of 2015, respectively.
• Bank owned/REO properties comprised 3.3% of new listings and 4.1% of sales in the first quarter of 2016, down 0.3% and exactly matching the fourth quarter of 2015, respectively.
If you’d like more information or percentages of distressed residential sales in other areas not represented by our charts, please contact us at communications@rmls.com.
by RMLS Communication Department | Apr 18, 2016 | Lockbox, Statistics
This Week’s Lockbox Activity
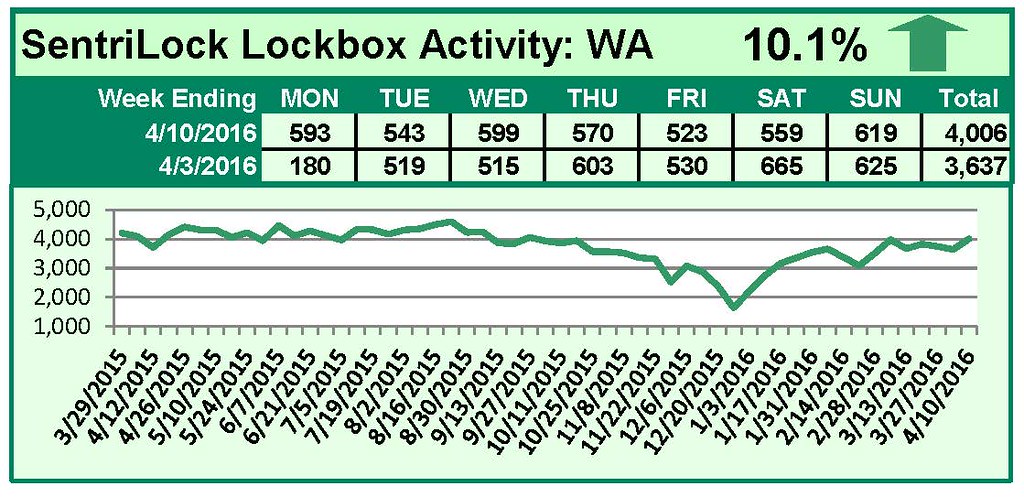
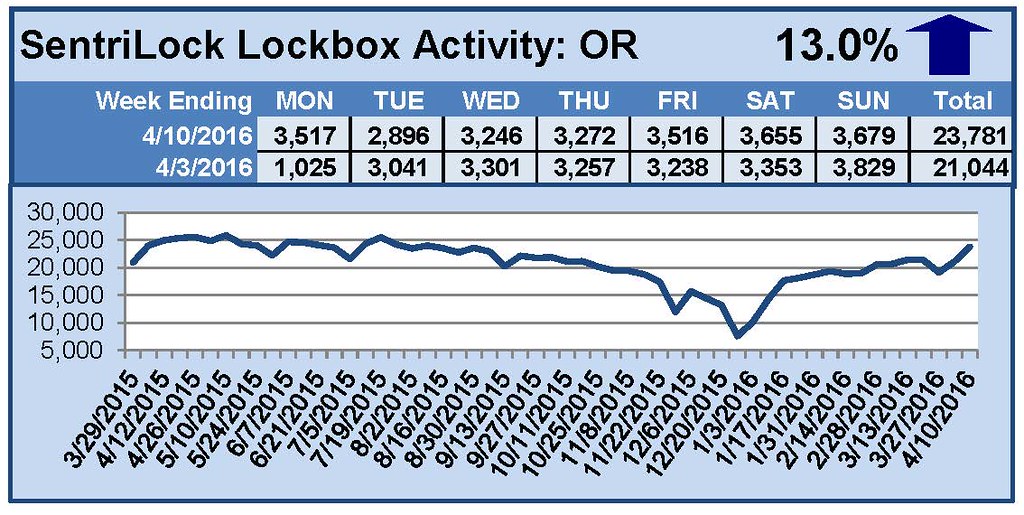
For the week of April 4-10, 2016, these charts show the number of times RMLS™ subscribers opened SentriLock lockboxes in Oregon and Washington. Activity rose in both Oregon and Washington this week.
For a larger version of each chart, visit the RMLS™ photostream on Flickr.
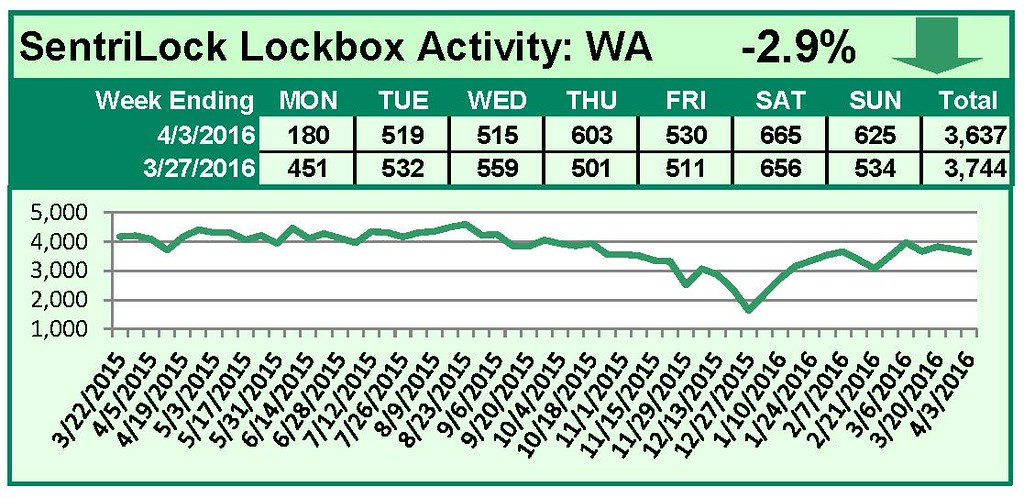
by RMLS Communication Department | Apr 11, 2016 | Lockbox, Statistics
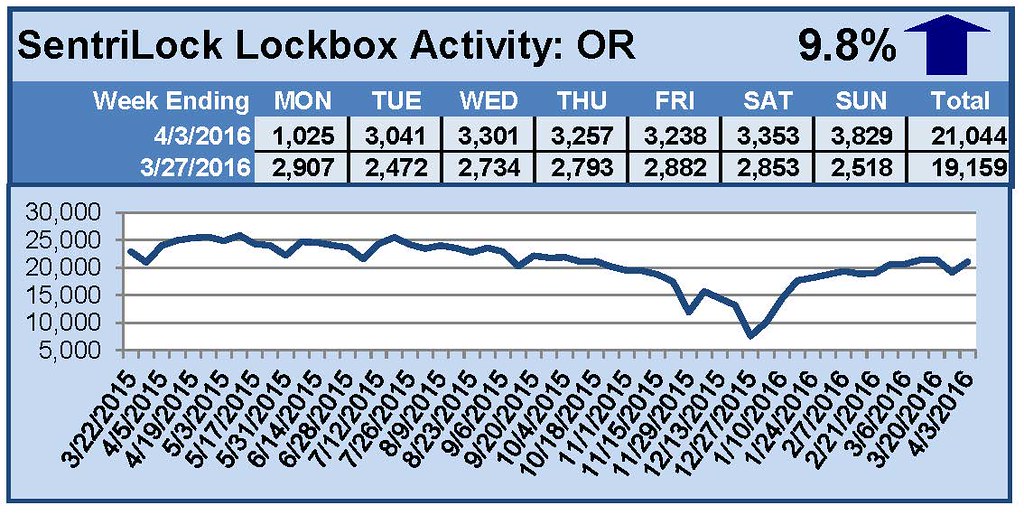
This Week’s Lockbox Activity
For the week of March 28-April 3, 2016, these charts show the number of times RMLS™ subscribers opened SentriLock lockboxes in Oregon and Washington. Activity rose in Oregon and decreased in Washington this week.
For a larger version of each chart, visit the RMLS™ photostream on Flickr.