by RMLS Communication Department | May 11, 2015 | Lockbox, Statistics
This Week’s Lockbox Activity
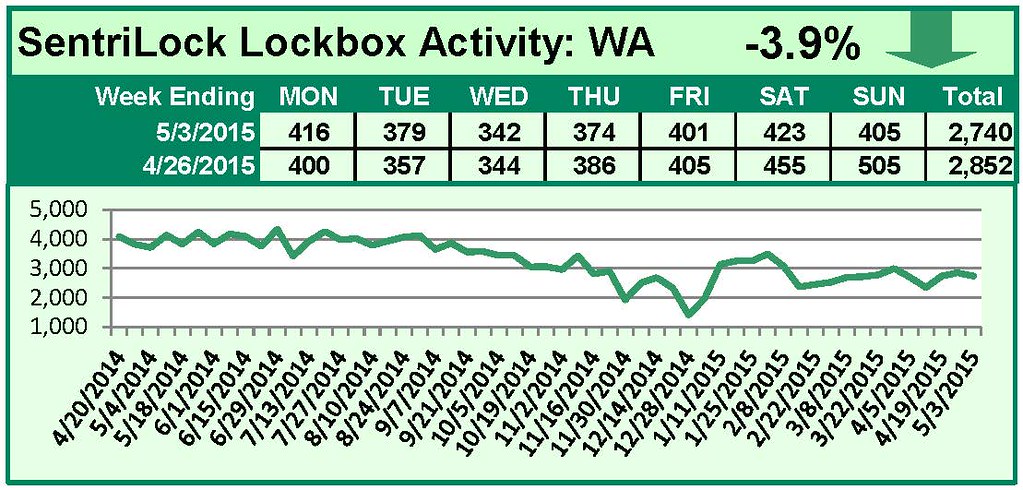
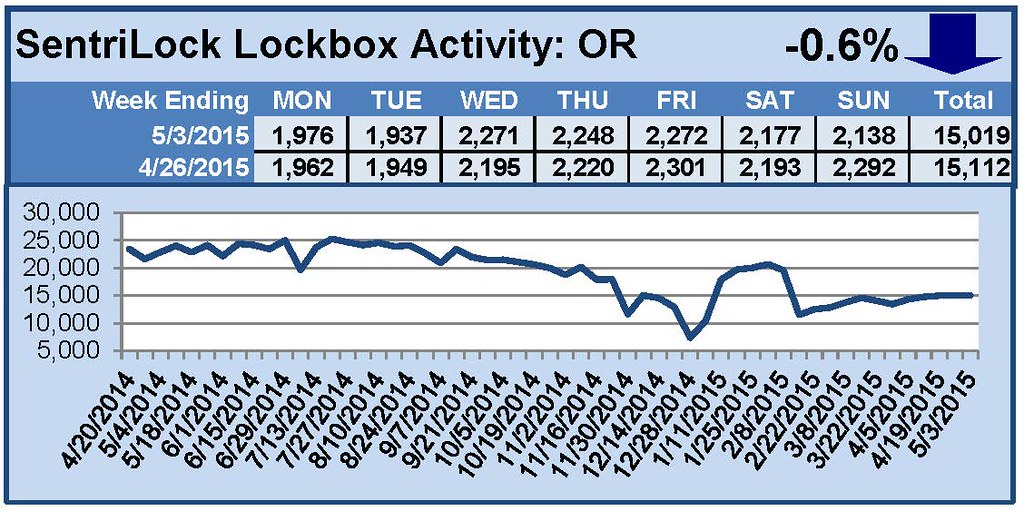
For the week of April 27-May 3, 2015, these charts show the number of times RMLS™ subscribers opened SentriLock lockboxes in Oregon and Washington. Activity in both states decreased this week.
For a larger version of each chart, visit the RMLS™ photostream on Flickr.
![Have You Claimed Your Realtor.com Profile Page?]()
by RMLS Communication Department | May 6, 2015 | Industry News

The National Association of REALTORS® (NAR) recently released a new tool to manage what potential clients learn about you on Realtor.com and major social media sites.
Have you claimed your free Realtor.com profile page yet?
The Realtor.com profile page is a one-stop portal that allows NAR members to connect with clients looking for a REALTOR® while searching for homes on Realtor.com.
The profile allows each REALTOR® to manage the display of information and client recommendations from a variety of social sites, including Facebook, Twitter, and LinkedIn. This means clients can easily find an experienced REALTOR® with a particular specialization or language, or discover a REALTOR® who has served someone they know. One-stop shopping for clients, and easy lead generation for brokers!
What do you need to start? A NRDS number and your browser. Claim your profile today on Realtor.com, then peruse the quick start guide to make the most of your new profile.


by RMLS Communication Department | May 5, 2015 | Misc.
 John Van Loo passed away on April 23, 2015, leaving a substantial hole in our real estate community. RMLS™ joins his family, friends, fellow REALTORS®, and co-workers at RE/MAX Equity group in mourning his loss. John served as a valued Director on the RMLS™ Board of Directors for eleven years. He joined the board in 1994 for his first term which ended in 1996, and then rejoined in 2004, serving through 2011.
John was the Chairman of the Board in 2008, and gently guided RMLS™ through a difficult year. Our then CEO, Beth Murphy, was out on an extended medical leave through much of the second half of the year and the recession was was making itself felt. Budgets needed to be pared. In all, John served RMLS™ on the Executive Committee for five years from 2005-2009.
Like so many people, I was a personal recipient of his wonderful nature. In the year John was our Board Chairman, I was meeting him for dinner at the end of a long trip to the NAR mid-year meetings in Washington, DC. Arriving at the restaurant to meet him, I foolishly left my wallet in the cab and it sped away. Nothing could have exceeded the kindness and practical help that John and his family provided. My wallet was miraculously returned, but I never forgot that glimpse of John’s true humanity.
Kurt von Wasmuth, our RMLS™ President and CEO, was appointed Acting CEO during John’s chairmanship in 2008. In his words, “John was a dedicated leader that helped guide RMLS™ during a time when we needed him the most. He will be sorely missed.”
A celebration of John Van Loo’s life will be held on Thursday, May 28, 2015, at Abundant Life Church in Happy Valley, OR.
by RMLS Communication Department | May 4, 2015 | Lockbox, Statistics
This Week’s Lockbox Activity
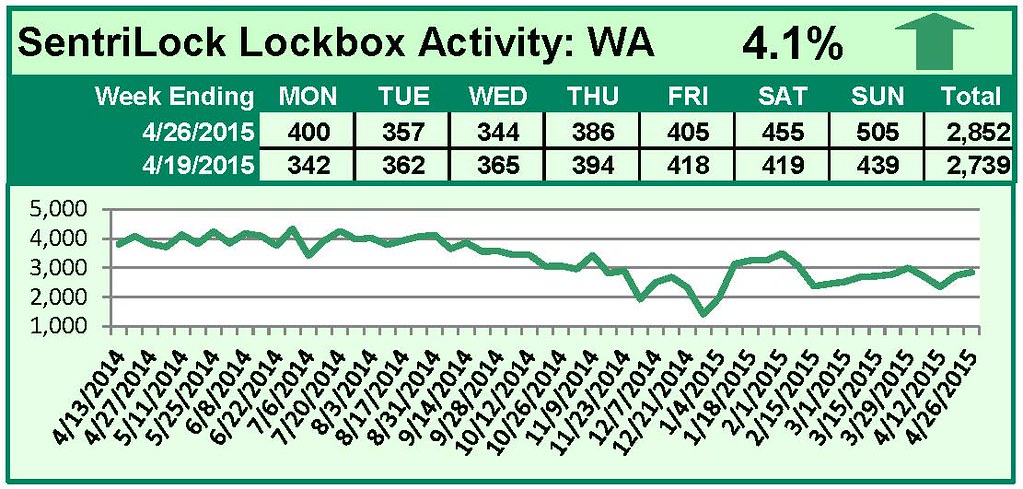
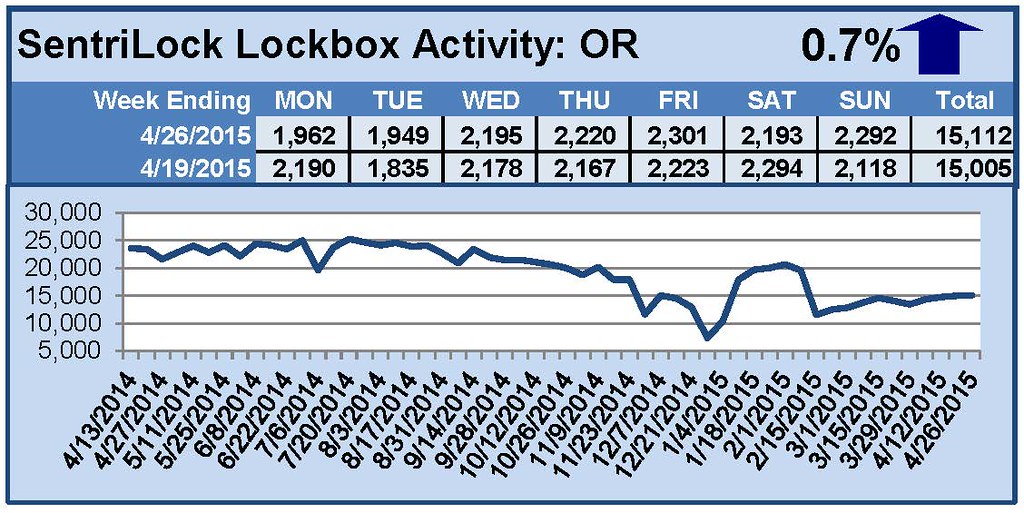
For the week of April 20-26, 2015, these charts show the number of times RMLS™ subscribers opened SentriLock lockboxes in Oregon and Washington. Activity in both Oregon and Washington increased this week.
For a larger version of each chart, visit the RMLS™ photostream on Flickr.
![Have You Claimed Your Realtor.com Profile Page?]()
by RMLS Communication Department | Apr 30, 2015 | RMLSweb

Distribution Services Staff Kim Hutchinson and Jeff Mitchell.
MLS Insight is a series about how things work at RMLS™.
Distribution Services at RMLS™ facilitates and manages the electronic transfer of RMLS™ listings outside of RMLSweb. RMLS™ listings appear on the internet and are utilized in applications that support REALTORS®—all in accordance with agreements between RMLS™, our real estate firm participants, and third party vendors. Currently we have almost 6,000 active data access agreements.
When RMLS™ began serving REALTORS® in 1991, there were no property listings on the internet. In fact, as natural and universal as the internet now seems, the World Wide Web was only invented in 1989 and it was not until 1993 that commercial providers were allowed to sell internet connections to individuals. That is when the explosion began in earnest and web traffic over the internet increased by 300,000%.
At RMLS™, an internet presence was approved by the Board of Directors in November 1995, and the first appearance of RMLS™ listings occurred in late April 1996. The internet created radical change in the way business was conducted in many industries, and 1998 was a year of intense discussion and debate in the real estate community about how the internet could and should be integrated into the multiple listing service. That November, the consensus from those discussions became the first RMLS™ Internet Policy. It put the brokerage in the driver’s seat. The basic premise of that first policy—that no listings would be posted on internet without the consent of the participating firm—remains the guiding principle for data distribution today.
Today, RMLS™ listing data is utilized in a variety of ways by our participants. Many offices and individual brokers have their own websites, where they display the listing data according to the IDX (Internet Data Exchange) and/or VOW (Virtual Office Website) policies. These policies are hammered out by National Association of REALTORS®. Firms may also instruct us to send only their own listings to various internet portals or syndication aggregators. This is how listings are funneled to sites like Zillow, Homes.com, OregonLive, etc. Firms can also request data sets to drive products that are used internally, with no consumer display. These can include statistical analysis, AVM creation, CRM programs, transaction management platforms, etc. Because Distribution Services is not part of the core MLS service, data access fees are charged that offset the expense of the program. The service providers, not the subscribers, pay these access fees.
Jeff Mitchell, Distribution Services Technician, manages all the agreements and administers the flow of data. Jeff says that when our subscribers ask about the format of the IDX data, he explains “RMLS™ makes IDX data available in a raw data format, so you will need an IDX Service Provider to process and populate this data on your website.” Forms and Documents on RMLSweb has a list of IDX service providers that are already established with RMLS™. Each of these service providers offer different services, as well as different monthly fees. We are also happy to work with new providers, but it takes some time for them to ramp up.
Kim Hutchinson, Data Quality Technician, works with the RETS computer that dishes up the data. Kim, along with other staff at RMLS™, work closely with RESO, the Real Estate Standards Organization, whose mission is the standardization of both the process and real estate data that is distributed. This benefits our subscribers by increasing the variety of tools and applications available to them.
The Distribution Services department is committed facilitating the flow of our participants’ listings outward in accordance with their direction and with timeliness, quality, and efficiency. You can contact Distribution Services via email or by phone at 503-872-8053.
The next post will focus on the RMLS™ Forms Committee. If you have questions on any RMLS™-related topic that you would like to have answered, I encourage you to post a comment.
