![2015 RMLS™ Spring Education Summit and Trade Fair]()
by RMLS Communication Department | Feb 12, 2015 | Events, RMLS News
 WANTED: Pending or Sold
The RMLS™ Spring Education Summit and Trade Fair will be held on Thursday, March 19, 2015, from 8:30am-4:30pm at the World Forestry Center in Portland.
FREE CE hours are available for both Oregon and Washington REALTORS®, but classes are filling quickly. Register ASAP to ensure a seat.
Plan your day:
• View a complete schedule of classes
• Read class description and instructor bios
Sprinkled throughout the World Forestry Center campus, trade fair exhibitors will be on hand to offer the best in services, technology, and tools for your business needs. Subscribers are encouraged to bring business cards for easy entry into door prize drawings.
Thanks to our generous sponsors!
DIAMOND

PLATINUM

SILVER

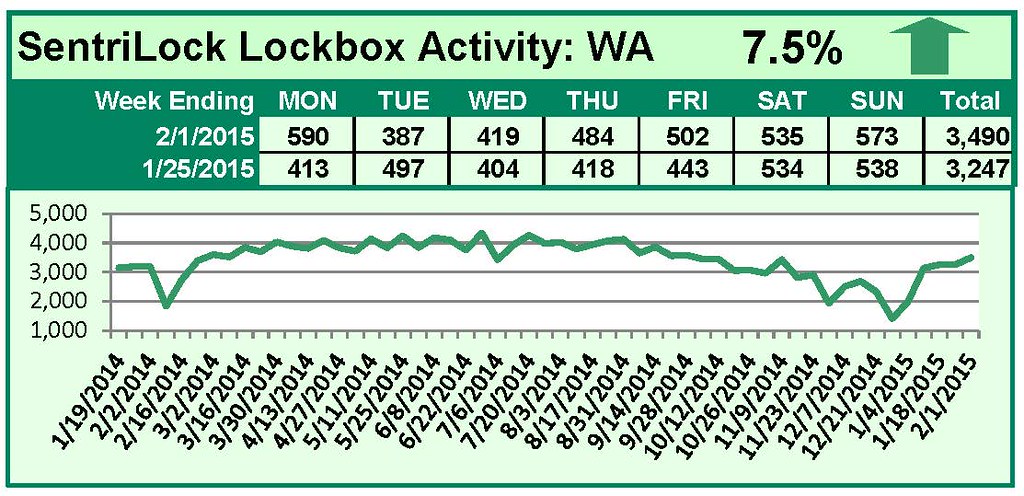
by RMLS Communication Department | Feb 9, 2015 | Lockbox, Statistics
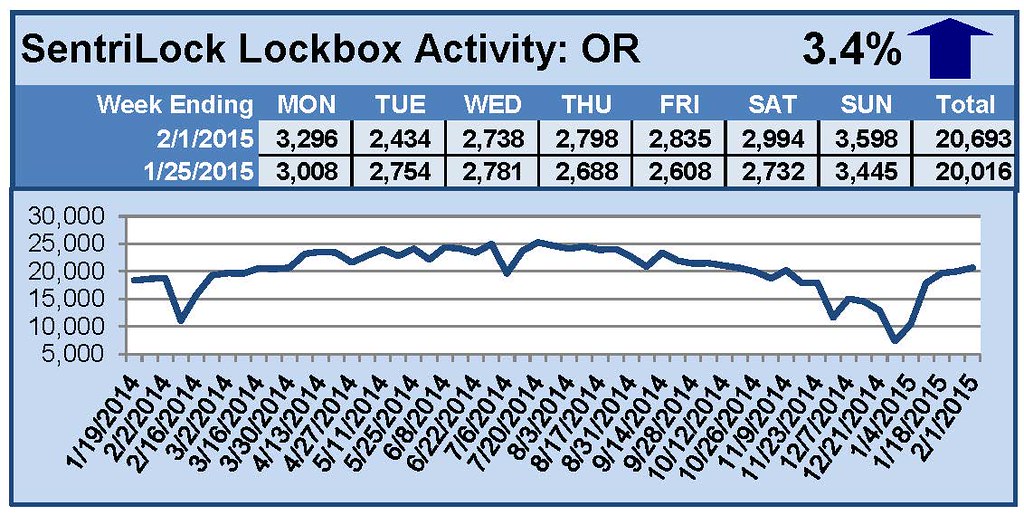
This Week’s Lockbox Activity
For the week of January 26-February 1, 2015, these charts show the number of times RMLS™ subscribers opened SentriLock lockboxes in Oregon and Washington. Activity in both states increased this week.
For a larger version of each chart, visit the RMLS™ photostream on Flickr.
by RMLS Communication Department | Feb 4, 2015 | Fun Facts, RMLSweb, Statistics
How much work does RMLS™ do for thousands of subscribers across Oregon and Southwest Washington? This is the second year we’ve compiled numbers to show just how much RMLS™ has supported real estate activity over the course of a single year (read RMLS™ by the Numbers 2013).
RMLSweb
Number of times subscribers logged in to RMLSweb: 1,475,802
Photos uploaded to listings: 1,138,099
Property searches run: 513,354
Number of new prospect profiles created: 63,943
All residential properties listed for sale: 69,541
All residential properties sold: 48,052
Median sold price of homes listed: $251,000
Total dollar volume of homes sold: $14,067,725,000
Unique tax searches: 107,750
Reports viewed: 9,301,407
Broker tour searches run: 12,876
Open house searches run: 8,364
Statistical searches run: 26,926
RMLS™ Subscribers
RMLS™ subscribers as of December 2014: 11,279
New RMLS™ subscribers (compared to December 2013): 603
Increase in subscribers, above: +5.7%
Subscribers who attended training: 3,047
Number of calls to the RMLS™ Help Desk: 22,978
Number of Help Desk chats: 3,012
Number of incidents reported using the “Report Issue” button: 5,299
CE hours distributed by RMLS™ at no cost to subscribers: 4,260
Total attendance at RMLS™ training events: 4,800
RMLS.com
Total customer visits to RMLS.com: 3,375,870
Unique visits: 1,082,046
Total listing views: 2,299,823
Social Media
RMLS™ followers on Facebook (December 31st): 2,930
RMLS™ followers on Twitter (December 31st): 2,358
Don’t forget about the other numbers we regularly compile! In addition to publishing Market Action each month, we have statistical summaries available on RMLSweb with information dating back several years. Since 2012 we’ve also been compiling statistics about residential distressed properties in RMLSweb.
We love numbers here at RMLS™, and hope you find this data as fun and interesting as we do.
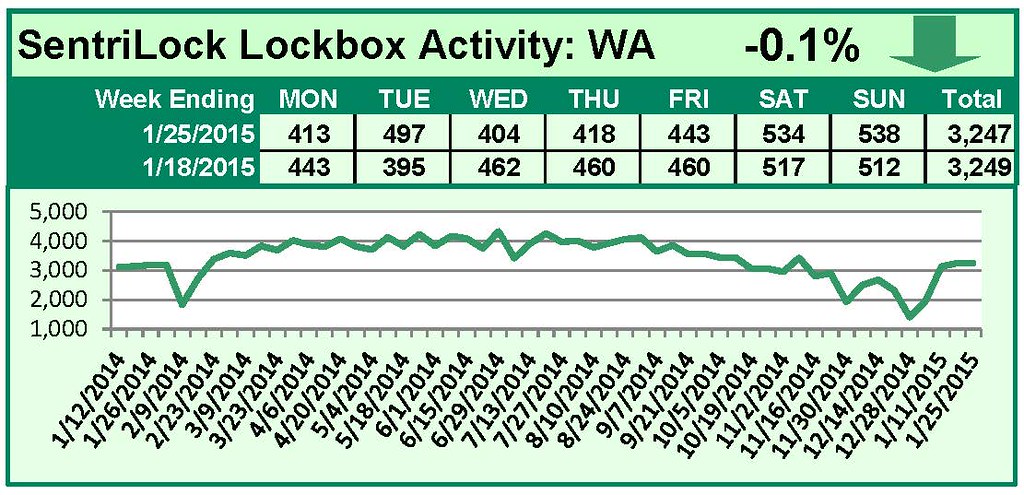
by RMLS Communication Department | Feb 2, 2015 | Lockbox, Statistics
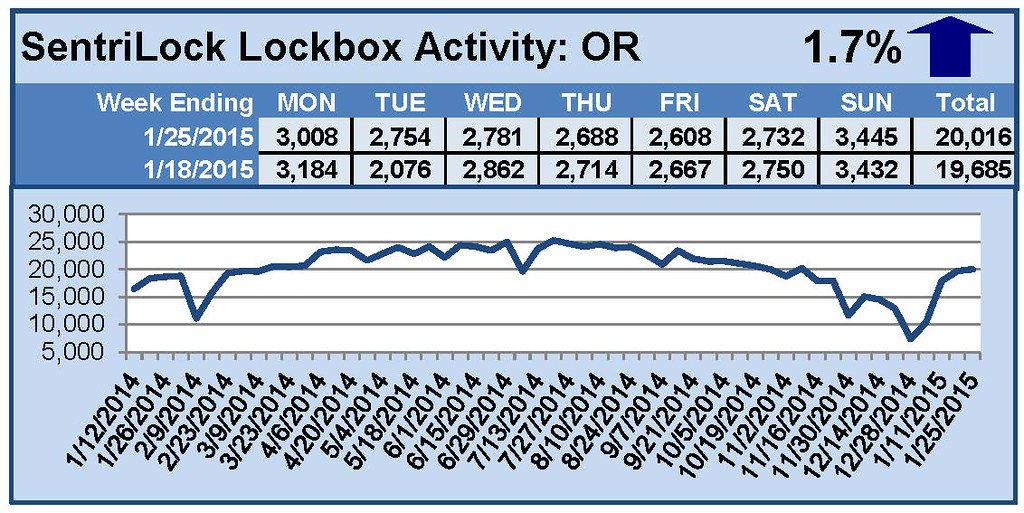
This Week’s Lockbox Activity
For the week of January 19-25, 2015, these charts show the number of times RMLS™ subscribers opened SentriLock lockboxes in Oregon and Washington. Activity in Oregon increased this week, and activity in Washington fell slightly.
For a larger version of each chart, visit the RMLS™ photostream on Flickr.
![2015 RMLS™ Spring Education Summit and Trade Fair]()
by RMLS Communication Department | Jan 30, 2015 | RMLSweb
 MLS Insight is a series about how things work at RMLS™.
RMLS™ began disaster recovery/business continuance (DR/BC) planning in earnest in 2002. The events of September 11, 2001, brought home the absolute necessity for this kind of planning, as it did for many businesses. Of course, part of running a responsible business has always been planning for emergencies and contingencies, but that process was formalized for RMLS™ starting in 2002.
Our first attempts at documenting the steps for disaster recovery were a little clumsy and hard to maintain. We are now on our third iteration of our DR/BC plan, and have refined it to identify the response needed for various types and levels of events—a snow day or an RMLSweb outage to the loss of our corporate facility due to earthquake or fire.
Everyone at RMLS™ has a role in helping to respond appropriately to situations that threaten the safety of employees and the continuity of the services we provide. Of course, the highest priority in any crisis is care for life and physical safety of anyone present, if that is an issue. After that, attention goes to reducing loss of data and assets. Since our service is critical to our subscribers, our goal is uninterrupted service, so a focus on speedy recovery and communication are key elements of our planning.
Part of that speedy recovery is having a redundant database and servers for RMLSweb. In 2008, we moved our DR/BC servers from a location in Portland to a building in Roseburg, built in partnership with the Douglas County Association of REALTORS®. Data is continually replicated to those servers, and during maintenance mode each month, RMLSweb actually operates from Roseburg while the main Portland servers receive their patches and updates.
Disaster recovery planning is not something that you can do once and forget about. It needs to be part of the business plan and a living, changing process
The next post will focus on listing data accuracy. If you have any questions you would like to have answered, I encourage you to post a comment.
Photo: iStockPhoto/Endurodog
