![Residential Distressed Properties for Fourth Quarter (October-December) 2014]()
by RMLS Communication Department | Jan 20, 2015 | Distressed Properties, Industry News, Market Trends, Statistics

This chart shows the number of bank owned/REO properties and short sales in all areas of the RMLS™ system during the fourth quarter of 2014.
Below are links to additional charts for some of our larger areas.
• Portland Metro Area Distressed Properties (4th Quarter 2014)
• Clark County, WA Distressed Properties (4th Quarter 2014)
• Lane County, OR Distressed Properties (4th Quarter 2014)
• Douglas County, OR Distressed Properties (4th Quarter 2014)
• Coos County, OR Distressed Properties (4th Quarter 2014)
Here are some additional facts about distressed residential properties in the fourth quarter of 2014:
All areas when comparing percentage share of the market, fourth quarter 2014 to third quarter 2014:
• When comparing the fourth quarter 2014 to third quarter 2014, distressed sales as a percentage of new listings increased by 4.9% (12.0 v. 7.1%).
• In a comparison of the fourth quarter 2014 to third quarter 2014, distressed sales as a percentage of closed sales increased by 0.7% (9.5 v. 8.8%).
• Short sales comprised 3.5% of new listings and 3.0% of sales in the fourth quarter of 2014, up 0.9% and down 0.3% from the third quarter of 2014, respectively.
• Bank owned/REO properties comprised 8.5% of new listings and 6.5% of sales in the fourth quarter of 2014, up 4.0% and 1.0% from the third quarter of 2014, respectively.
Portland metro when comparing percentage share of the market, fourth quarter 2014 to third quarter 2014:
• When comparing the fourth quarter 2014 to third quarter 2014, distressed sales as a percentage of new listings increased by 4.5% (10.7 v. 6.2%).
• In a comparison of fourth quarter 2014 to third quarter 2014, distressed sales as a percentage of closed sales increased by 1.0% (8.2 v. 7.2%).
• Short sales comprised 3.8% of new listings and 2.9% of sales in the fourth quarter of 2014, up 1.2% and down 0.4% from the third quarter of 2014, respectively.
• Bank owned/REO properties comprised 6.9% of new listings and 5.3% of sales in the fourth quarter of 2014, up 3.3% and 1.4% from the third quarter of 2014, respectively.
Clark County when comparing percentage share of the market, fourth quarter 2014 to third quarter 2014:
• When comparing the fourth quarter 2014 to third quarter 2014, distressed sales as a percentage of new listings increased by 3.9% (12.7 v. 8.8%).
• In a comparison of fourth quarter 2014 to third quarter 2014, distressed sales as a percentage of closed sales increased by 0.4% (11.5 v. 11.1%).
• Short sales comprised 4.4% of new listings and 4.3% of sales in the fourth quarter of 2014, up 0.6% for new listings and down 0.4% for sales when compared to the third quarter of 2014, respectively.
• Bank owned/REO properties comprised 8.3% of new listings and 7.2% of sales in the fourth quarter of 2014, up 3.3% and 0.8% from the third quarter of 2014, respectively.
If you’d like more information or percentages of distressed residential sales in other areas not represented by our charts, please contact us at communications@rmls.com.
![Residential Distressed Properties for Fourth Quarter (October-December) 2014]()
by RMLS Communication Department | Oct 16, 2014 | Distressed Properties, Industry News, Market Trends, Statistics
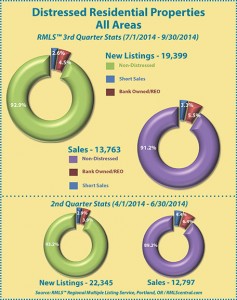
This chart shows the number of bank owned/REO properties and short sales in all areas of the RMLS™ system during the third quarter of 2014.
Below are links to additional charts for some of our larger areas.
• Portland Metro Distressed Properties (3rd Quarter 2014)
• Clark County, WA Distressed Properties (3rd Quarter 2014)
• Lane County, OR Distressed Properties (3rd Quarter 2014)
• Douglas County, OR Distressed Properties (3rd Quarter 2014)
• Coos County, OR Distressed Properties (3rd Quarter 2014)
Here are some additional facts about distressed residential properties in the third quarter of 2014:
All areas when comparing percentage share of the market, third quarter 2014 to second quarter 2014:
• When comparing the third quarter 2014 to second quarter 2014, distressed sales as a percentage of new listings increased by 0.3% (7.1 v. 6.8%).
• In a comparison of the third quarter 2014 to second quarter 2014, distressed sales as a percentage of closed sales decreased by 2.0% (8.8 vs. 10.8%).
• Short sales comprised 2.6% of new listings and 3.3% of sales in the third quarter of 2014, down 0.3% and 1.1% from the second quarter of 2014, respectively.
• Bank owned/REO properties comprised 4.5% of new listings and 5.5% of sales in the third quarter of 2014, up 0.6% and down 0.9% from the second quarter of 2014, respectively.
Portland metro when comparing percentage share of the market, third quarter 2014 to second quarter 2014:
• When comparing the third quarter 2014 to second quarter 2014, distressed sales as a percentage of new listings increased by 0.1% (6.2 vs. 6.1%).
• In a comparison of third quarter 2014 to second quarter 2014, distressed sales as a percentage of closed sales decreased by 1.6% (7.2 v. 8.8%).
• Short sales comprised 2.6% of new listings and 3.3% of sales in the third quarter of 2014, down 0.4% and 0.8% from the second quarter of 2014, respectively.
• Bank owned/REO properties comprised 3.6% of new listings and 3.9% of sales in the third quarter of 2014, up 0.5% and down 0.8% from the second quarter of 2014, respectively.
Clark County when comparing percentage share of the market, third quarter 2014 to second quarter 2014:
• When comparing the third quarter 2014 to second quarter 2014, distressed sales as a percentage of new listings decreased by 0.6% (8.8 v. 9.4%).
• In a comparison of third quarter 2014 to second quarter 2014, distressed sales as a percentage of closed sales decreased by 4.7% (11.1 v. 15.8%).
• Short sales comprised 3.8% of new listings and 4.7% of sales in the third quarter of 2014, down 0.9% for new listings and 2.0% for sales when compared to the second quarter of 2014, respectively.
• Bank owned/REO properties comprised 5.0% of new listings and 6.4% of sales in the third quarter of 2014, up 0.3% and down 2.7% from the second quarter of 2014, respectively.
If you’d like more information or percentages of distressed residential sales in other areas not represented by our charts, please contact us at communications@rmls.com.
![Residential Distressed Properties for Fourth Quarter (October-December) 2014]()
by RMLS Communication Department | Jul 16, 2014 | Distressed Properties, Industry News, Market Trends, Statistics
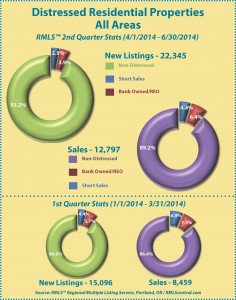
This chart shows the number of bank owned/REO properties and short sales in all areas of the RMLS™ system during the second quarter of 2014.
Below are links to additional charts for some of our larger areas.
• Portland Metro Distressed Properties (2nd Quarter 2014)
• Clark County, WA Distressed Properties (2nd Quarter 2014)
• Lane County, OR Distressed Properties (2nd Quarter 2014)
• Douglas County, OR Distressed Properties (2nd Quarter 2014)
• Coos County, OR Distressed Properties (2nd Quarter 2014)
Here are some additional facts about distressed residential properties in the second quarter of 2014:
All areas when comparing percentage share of the market, second quarter 2014 to first quarter 2014:
• When comparing the second quarter 2014 to first quarter 2014, distressed sales as a percentage of new listings decreased by 3.3% (6.8 v. 10.1%).
• In a comparison of the second quarter 2014 to first quarter 2014, distressed sales as a percentage of closed sales decreased by 2.8% (10.8 v. 13.6%).
• Short sales comprised 2.9% of new listings and 4.4% of sales in the second quarter of 2014, down 1.5% and 1.9% from the first quarter of 2014, respectively.
• Bank owned/REO properties comprised 3.9% of new listings and 6.4% of sales in the second quarter of 2014, down 1.8% and 0.9% from the first quarter of 2014, respectively.
Portland metro when comparing percentage share of the market, second quarter 2014 to first quarter 2014:
• When comparing the second quarter 2014 to first quarter 2014, distressed sales as a percentage of new listings decreased by 2.8% (6.1 v. 8.9%).
• In a comparison of second quarter 2014 to first quarter 2014, distressed sales as a percentage of closed sales decreased by 2.2% (8.8 v. 11.0%).
• Short sales comprised 3.0% of new listings and 4.1% of sales in the second quarter of 2014, down 1.3% and 2.0% from the first quarter of 2014, respectively.
• Bank owned/REO properties comprised 3.1% of new listings and 4.7% of sales in the second quarter of 2014, down 1.5% and 0.2% from the first quarter of 2014, respectively.
Clark County when comparing percentage share of the market, second quarter 2014 to first quarter 2014:
• When comparing the second quarter 2014 to first quarter 2014, distressed sales as a percentage of new listings decreased by 3.1% (9.4 v. 12.5%).
• In a comparison of second quarter 2014 to first quarter 2014, distressed sales as a percentage of closed sales decreased by 7.3% (15.8 v. 23.1%).
• Short sales comprised 4.7% of new listings and 6.7% of sales in the second quarter of 2014, down 1.2% for new listings and 4.2% for sales when compared to the first quarter of 2014, respectively.
• Bank owned/REO properties comprised 4.7% of new listings and 9.1% of sales in the second quarter of 2014, down 1.9% and 3.1% from the first quarter of 2014, respectively.
If you’d like more information or percentages of distressed residential sales in other areas not represented by our charts, please contact us at communications@rmls.com.
![Residential Distressed Properties for Fourth Quarter (October-December) 2014]()
by Heather Andrews | Jun 13, 2014 | Distressed Properties
RMLS™ knows just how popular our quarterly distressed properties infographics are. We often get an inquiry or two before the end of each quarter—and once they’re released, we hear from others looking for information for their part of the RMLS™ region, or sometimes a particular town inside a larger area.
Subscribers can pull their own data using RMLSweb for whatever county, city, ZIP, or area number they’d like. Here’s how.

On RMLSweb, hover over the Statistics menu and select “Market Stats” (above). You’ll be running a total of six searches using this feature to recreate the information RMLS™ provides on our distressed infographics.
 SEARCH #1: Finding All Listed Properties
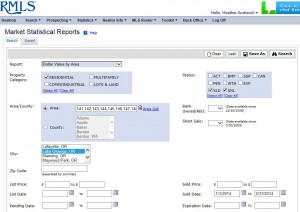
In the “Report” drop down menu, select “Dollar Value by Area.” Check whichever property categories you’re interested in finding (most subscribers will want “Residential”), and check all the statuses in the “Status” box.
Here’s where each search will be different depending on what you’re looking for. You can search using the area box (or type in a range, such as 145-148); select a county; select a city; or type in a ZIP code.
Narrow the search by typing dates into List Date. We generated first quarter data by asking for 1/1/2014 through 3/31/2014, but you might want to pull numbers for a different time frame.
Press on the Search button in the upper right of the window, and look at the summary row under “Total Props.” In our example (above), this gives you all properties listed in Lake Oswego during the first quarter of 2014.
SEARCH #2: Finding All Listed Short Sales
Follow the steps above, but check “Yes” on the Short Sale drop-down menu. Press on the Search button in the upper right of the window, and look at the summary row under “Total Props.” In our example, this gives you all short sale properties listed in Lake Oswego during the first quarter of 2014.
SEARCH #3: Finding All Listed Bank-Owned/REO Properties
Follow the steps in Search #1, but check “Yes” on the Bank Owned/REO drop-down menu. (If you did Search #2, don’t forget to clear out the Short Sale field!) Press on the Search button in the upper right of the window, and look at the summary row under “Total Props.” In our example, this gives you all Bank Owned/REO properties listed in Lake Oswego during the first quarter of 2014.
SEARCH #4: Finding All Sold Properties
In the “Report” drop down menu, select “Dollar Value by Area.” Check whichever property categories you’re interested in finding (most subscribers will want “Residential”), and check SLD and SNL in the “Status” box.
Here’s where each search will be different depending on what you’re looking for. You can search using the area box (or type in a range, such as 145-148); select a county; select a city; or type in a ZIP code.
Narrow the search by typing dates into Sold Date. We generated first quarter data by asking for 1/1/2014 through 3/31/2014, but you might want to pull numbers for a different time frame.
Press on the Search button in the upper right of the window, and look at the summary row under “Total Props.” In our example (above), this gives you all properties sold in Lake Oswego during the first quarter of 2014.
SEARCH #5: Finding All Sold Short Sales
Follow the steps in Search #4, but check “Yes” on the Short Sale drop-down menu. Press on the Search button in the upper right of the window, and look at the summary row under “Total Props.” In our example, this gives you all short sale properties sold in Lake Oswego during the first quarter of 2014.
SEARCH #6: Finding All Sold Bank-Owned/REO Properties
Follow the steps in Search #4, but check “Yes” on the Bank Owned/REO drop-down menu. (If you did Search #5, don’t forget to clear out the Short Sale field!) Press on the Search button in the upper right of the window, and look at the summary row under “Total Props.” In our example, this gives you all Bank Owned/REO properties sold in Lake Oswego during the first quarter of 2014.
That’s it!
If you have access to graphics software, you can use your custom searches to develop graphics for distribution to clients. As always, all we ask is that you cite RMLS™ as the source of your data.
![Residential Distressed Properties for Fourth Quarter (October-December) 2014]()
by RMLS Communication Department | Apr 17, 2014 | Distressed Properties, Industry News, Market Trends, Statistics
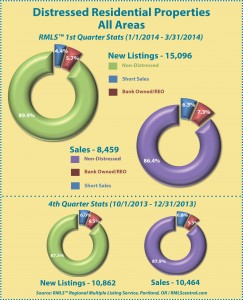
This chart shows the number of bank owned/REO properties and short sales in all areas of the RMLS™ system during the first quarter of 2014.
Below are links to additional charts for some of our larger areas.
• Portland Metro Distressed Properties (1st Quarter 2014)
• Clark County, WA Distressed Properties (1st Quarter 2014)
• Lane County, OR Distressed Properties (1st Quarter 2014)
• Douglas County, OR Distressed Properties (1st Quarter 2014)
• Coos County, OR Distressed Properties (1st Quarter 2014)
Here are some additional facts about distressed residential properties in the first quarter of 2014:
All areas when comparing percentage share of the market, first quarter 2014 to fourth quarter 2013:
• When comparing the first quarter 2014 to fourth quarter 2013, distressed sales as a percentage of new listings decreased by 2.4% (10.1 v. 12.5%).
• In a comparison of the first quarter 2014 to fourth quarter 2013, distressed sales as a percentage of closed sales increased by 1.5% (13.6 v. 12.1%).
• Short sales comprised 4.4% of new listings and 6.3% of sales in the first quarter of 2014, down 1.6% and 0.5% from the fourth quarter of 2013, respectively.
• Bank owned/REO properties comprised 5.7% of new listings and 7.3% of sales in the first quarter of 2014, down 0.8% and up 2.0% from the fourth quarter of 2013, respectively.
Portland metro when comparing percentage share of the market, first quarter 2014 to fourth quarter 2013:
• When comparing the first quarter 2014 to fourth quarter 2013, distressed sales as a percentage of new listings decreased by 1.7% (8.9 v. 10.6%).
• In a comparison of first quarter 2014 to fourth quarter 2013, distressed sales as a percentage of closed sales increased by 0.2% (11.0 v. 10.8%).
• Short sales comprised 4.3% of new listings and 6.1% of sales in the first quarter of 2014, down 1.7% and 1.1% from the fourth quarter of 2013, respectively.
• Bank owned/REO properties comprised 4.6% of new listings and 4.9% of sales in the first quarter of 2014, even with and up 1.3% from the fourth quarter of 2013, respectively.
Clark County when comparing percentage share of the market, first quarter 2014 to fourth quarter 2013:
• When comparing the first quarter 2014 to fourth quarter 2013, distressed sales as a percentage of new listings decreased by 6.1% (12.5 v. 18.6%).
• In a comparison of first quarter 2014 to fourth quarter 2013, distressed sales as a percentage of closed sales increased by 5.5% (23.1 vs. 17.6%).
• Short sales comprised 5.9% of new listings and 10.9% of sales in the first quarter of 2014, up 2.3% for new listings and 1.8% for sales when compared to the fourth quarter of 2013, respectively.
• Bank owned/REO properties comprised 6.6% of new listings and 12.2% of sales in the first quarter of 2014, down 3.8% and up 3.7% from the fourth quarter of 2013, respectively.
If you’d like more information or percentages of distressed residential sales in other areas not represented by our charts, please contact us at communications@rmls.com.
![Residential Distressed Properties for Fourth Quarter (October-December) 2014]()
by RMLS Communication Department | Feb 5, 2014 | Distressed Properties, Statistics
The chart below shows the number of bank owned/REO and short sales in all areas of the RMLS™ system during 2013.
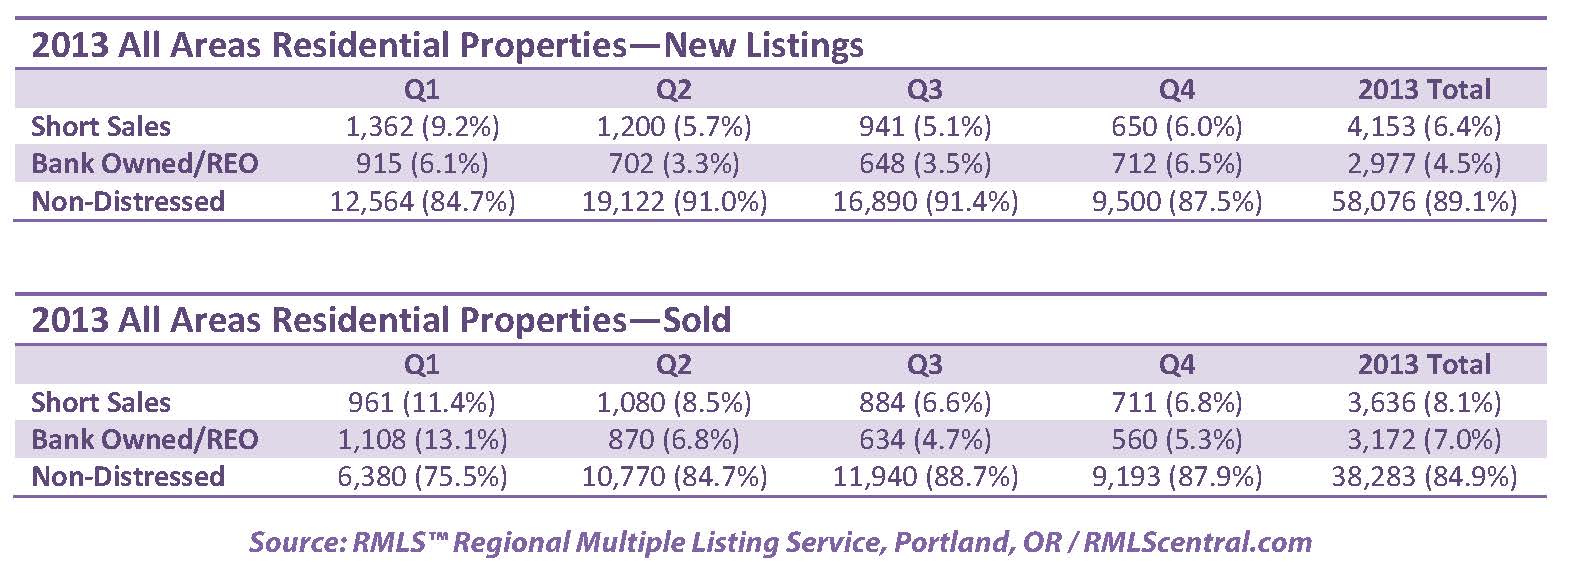
All areas when comparing percentage share of the market 2012 to 2013:
• Comparing 2012 to 2013, distressed sales as a percentage of closed sales decreased from 28.6% to 15.1%.
• New listings rose from 58,280 to 65,206 which is a 11.8% increase.
• Short sales comprised 6.4% of new listings and 8.1% of sold listings in 2013, down 4.9% and 4.0% from 2012 respectively as a percentage of the market.
• Bank owned/REO properties comprised 4.5% of new listings and 7.0% of sales in 2013, decreasing slightly from 10.3% and 16.5% respectively in 2012.
Portland metro when comparing percentage share of the market 2012 to 2013:
• Comparing 2012 to 2013, distressed sales as a percentage of closed sales decreased from 28.2% to 13.2%.
• New listings rose from 32,011 to 35,524 which is a 11.0% increase.
• Short sales comprised 6.4% of new listings and 8.0% of sold listings in 2013, down 5.7% and 4.3% from 2012 respectively as a percentage of the market.
• Bank owned/REO properties comprised 3.3% of new listings and 5.2% of sales in 2013, decreasing from 10.4% and 15.9% respectively in 2012.
Clark County when comparing percentage share of the market 2012 to 2013:
• Comparing 2012 to 2013, distressed sales as a percentage of closed sales decreased from 32.2% to 22.4%.
• New listings rose from 7,280 to 9,079 which is a 24.7% increase.
• Short sales comprised 10.0% of new listings and 12.7% of sold listings in 2013, down 9.1% and 5.8% from 2012 respectively as a percentage of the market.
• Bank owned/REO properties comprised 7.8% of new listings and 9.7% of sales in 2013, decreasing from 8.8% and 13.7% respectively in 2012.
Below are links to additional charts for some of our larger areas:
Portland Metro
Clark County, WA
Lane County, OR
Douglas County, OR
Coos County, OR
If you want information on percentages of distressed sales in other areas not represented by our charts, please contact us at communications@rmls.com.


