by RMLS Communication Department | Aug 13, 2009 | Clark County, Coos County, Curry County, Douglas County, Lane County, Market Trends, Oregon Real Estate, Portland, Statistics, Union County, Washington Real Estate
We released the latest Market Action reports to RMLS™ subscribers yesterday. Many areas of Oregon and Southwest Washington are showing improvement as far as sales and inventory go – here are a few highlights:

Portland Metro Active Listings: Note how the 2009 line is basically flat.
Inventory: Inventory is showing steady improvement in Portland (7.3 months), Clark County (7.3 months), and Lane County (6.2 months). In most circles, 6 months of supply is considered a balanced market. The drop in inventory comes thanks to strong closed sales, but also because the number of active listings is growing at a much slower pace than usual.
Closed sales: The Portland metro area was finally able to post a gain in same-month closed sales for the first time since April 2007. Closed sales were up 8.6% compared to last July. Clark County posted a gain for the second straight month – closed sales were up 23.5% there. Lane County also posted an 11% gain. Baker County, Curry County, Douglas County, and the Mid-Columbia region also saw growth.

Clark Co. Pending Sales: Oh, so close to reaching July 2007 levels.
Pending sales: Same-month pending sales in Clark County grew for the fourth month in a row at 30.3%. In fact, Clark County pending sales not only surpassed July 2008 levels, but they came close to hitting July 2007 levels. With the exception of the Mid-Columbia region and Union County, same-month pending sales grew in all of our primary service areas.

by RMLS Communication Department | Aug 5, 2009 | Clark County, Coos County, Douglas County, Events, Lane County, Oregon Real Estate, Portland, Salem, Washington Real Estate
 Here’s a quick rundown of upcoming Realtor® events & education for August in Oregon & Southern Washington. If you have an event that is not listed here, please let us know by commenting below. For future events, please send an e-mail to communications (at) rmls (dot) com.
– August 5:Realtor Day at NW Natural Street of Dreams – noon to 8 p.m.
– August 12: CCAR hosts Get Connected: Expose Yourself to Social Networking
– August 13: OAR hosts What’s going on with Short Sales (web seminar)
– August 13: Oregon CRS – CRS 205: Financing Course in Ashland, Oregon
– August 19: CCAR hosts Washington State Housing Finance Commission
– August 19: Douglas County Board of Realtors Membership Meeting – Speaker, Gene Bentley, Oregon Real Estate Agency Commissioner
– August 21: Southern Oregon Women’s Council of Realtors hosts – Qualifying for a FHA/VA Loan
Also, if you’re an RMLS™ subscriber, we have lots of FREE opportunities for continuing education credit at a location near you, click the link for your area to view the August Training Calendar:
– Coos County
– Eastern Oregon
– Eugene
– Florence
– Gresham
– Portland
– Roseburg
– Salem
– Vancouver
Image courtesy of Ayhan Yildiz
by RMLS Communication Department | Aug 4, 2009 | Industry News, Oregon Real Estate
Our friends over at Oregon Real Estate Forms (OREF) have issued the following update about the disclosure of Annual Percentage Rate:
OREF’s legal counsel, Phil Querin, advises all brokers in the state of Oregon to be aware of federal disclosure requirement that may cause a delay in closing.
Under new rules enacted by the Federal Reserve Board Truth in Lending Act, effective July 30, 2009 it is required that if the final Annual Percentage Rate (APR) changes by .125% or more as disclosed in the Good Faith Estimate there is a mandatory additional three business day waiting period before the transaction can close.
It is suggested that brokers get their buyers and sellers to agree in advance to a written extension as a contingency if the final APR causes the 3-day extension beyond the scheduled Closing Deadline such as:
“In the event that Buyer’s final Annual Percentage Rate (“APR”) differs from the APR initially disclosed to the Buyer in the Good Faith Estimate by .125% or more, the Closing Deadline defined in the Real Estate Sale Agreement shall automatically be extended for three (3) additional business days in accordance with Regulation Z of the Truth in Lending Act, as amended on July 30, 2008.”
If brokers encounter such a situation for a transaction already in process, they can extend the Closing Deadline by using an addendum form (OREF-002).
Caveat: This is not legal advice. All brokers should confer with their principal brokers and also recommend that their clients consult their own legal counsel if they have any questions.

by RMLS Communication Department | Aug 3, 2009 | Lockbox, Market Trends, Oregon Real Estate, Statistics, Washington Real Estate
Activity continues to slide, slightly
Comparing July 13, 2009 through July 26, 2009 the number of times RMLS™ subscribers opened Supra lockboxes decreased 1.4% in Washington and 1.9% in Oregon.


Click the chart for a larger view (Oregon, top; Washington, bottom)
Archive
View an archive of the Supra lockbox statistical reports on Flickr.

by RMLS Communication Department | Jul 31, 2009 | Market Trends, Oregon Real Estate, Washington Real Estate
With all the stories in the media, it seems like everyone is facing foreclosure these days. (Even Michael Jackson’s doctor.) So I thought it would be interesting to look at the foreclosure market in our service area to find out what’s really going on.
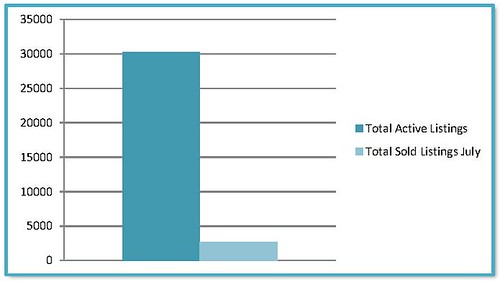
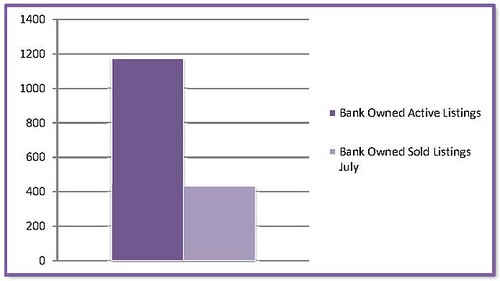
We currently have 30,276 active residential listings in RMLSweb–this includes Oregon and Washington. Of those, 1,172 are marked as Bank Owned. That’s approximately 3.9%.
Out of curiosity, I took my research a little further to find out how well Bank Owned properties are selling versus the entire inventory in our markets. So far in July 2009, 2,707 properties in our entire database sold. According to my research, 430 of them were marked Bank Owned.

If we didn’t add any more listings of any kind to RMLSweb and the active residential properties kept selling at the same rate they did in July it would take 11.2 months to sell our entire inventory and only 2.7 months to exhaust the inventory of Bank Owned Properties.

Granted, it’s only the morning of the last day of July so it’s likely that we’ll see the numbers of sales go up over the next few days, but this should give you a snapshot of what’s going on with Bank Owned properties.

by RMLS Communication Department | Jul 31, 2009 | Market Trends, Oregon Real Estate, Washington Real Estate
With all the stories in the media, it seems like everyone is facing foreclosure these days. (Even Michael Jackson’s doctor.) So I thought it would be interesting to look at the foreclosure market in our service area to find out what’s really going on.
We currently have 30,276 active residential listings in RMLSweb–this includes Oregon and Washington. Of those, 1,172 are marked as Bank Owned. That’s approximately 3.9%.
Out of curiosity, I took my research a little further to find out how well Bank Owned properties are selling versus the entire inventory in our markets. So far in July 2009, 2,707 properties in our entire database sold. According to my research, 430 of them were marked Bank Owned.

If we didn’t add any more listings of any kind to RMLSweb and the active residential properties kept selling at the same rate they did in July it would take 11.2 months to sell our entire inventory and only 2.7 months to exhaust the inventory of Bank Owned Properties.

Granted, it’s only the morning of the last day of July so it’s likely that we’ll see the numbers of sales go up over the next few days, but this should give you a snapshot of what’s going on with Bank Owned properties.


 Here’s a quick rundown of upcoming Realtor® events & education for August in Oregon & Southern Washington. If you have an event that is not listed here, please let us know by commenting below. For future events, please send an e-mail to communications (at) rmls (dot) com.


