by RMLS Communication Department | Sep 14, 2009 | Lockbox, Market Trends, Oregon Real Estate, Statistics, Washington Real Estate
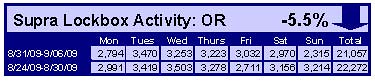
Lockbox Activity Down Over Labor Day Weekend
It appears some house hunters took a break to get in that last camping trip or to prepare their kids for school. In Washington, the number of times RMLS™ subscribers opened Supra lockboxes was down 8% when comparing the week of August 24-30 to the week of August 31-September 6. In Oregon activity was also down 5.5%.
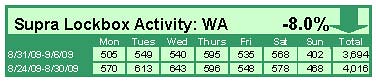

Click the chart for a larger view (Washington, top; Oregon, bottom)
Archive
View an archive of the Supra lockbox statistical reports on Flickr.
by RMLS Communication Department | Sep 8, 2009 | Lockbox, Market Trends, Oregon Real Estate, Statistics, Washington Real Estate
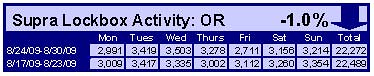
Washington Unchanged, Oregon Down Slightly
In Washington, the number of times RMLS™ subscribers opened Supra lockboxes was unchanged and in Oregon activity was down 1%. These stats reflect a comparison of the week of August 24-30 with the week of August 17-23.
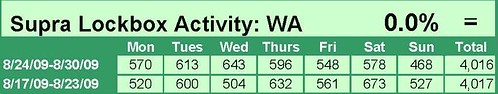

Click the chart for a larger view (Washington, top; Oregon, bottom)
Archive
View an archive of the Supra lockbox statistical reports on Flickr.

by RMLS Communication Department | Sep 8, 2009 | Statistics, Tips & Tricks
When to Expect the Latest Market Reports from RMLS™
This is a frequently asked question from subscribers here in my cubicle, so I thought I’d put the answer in writing.
My standard line is that Market Action is released around the 15th of each month. “Around” means it could be a day or two before, or a day or two after. It all depends on where the weekend falls.
We don’t generate any statistical reports for Market Action until the 10th day of each month. The reason we wait is to assure that almost all transactions are recorded in our database. If we were to run the reports on the 1st or 5th of each month, there’s a chance that many sales that occurred in the prior month might not be reported on RMLSweb yet. So, to assure what we report is an accurate reflection of what happened in the market that month, we wait until the 10th.

Editing time.
However, sometimes due to where the weekend falls, we can’t start working on the reports until the 11th, 12th, or sometimes even the 13th. Generating the reports, publishing, editing, posting and e-mailing then takes roughly 2.5 days of work.
So, for example, this month, I’ll start working on Thursday the 10th. But, I have to pause for the weekend, so the likely release date is Monday, September 14 or Tuesday, September 15.
Tip: If you’re eager to see the data, you can get a basic report on RMLSweb on the 11th of each month. The Home Sales Report (HSR) has a lot of the same data that we report in Market Action (number of sales, sale price, active listings).
The HSR can be accessed on RMLSweb by scrolling over Back Office and clicking on Home Sales Report. Then expand the folder for the year that you want, then the month, and then select the area you want to look at. If you want to look at the report for a broad area (such as the Portland Metro area), open the document that reads “combined report”. You can also look at reports for individual MLS areas or counties.
by RMLS Communication Department | Aug 31, 2009 | Lockbox, Market Trends, Statistics
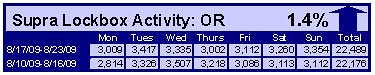
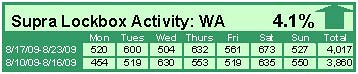
Lockbox activity up slightly
After a drop last week, lockbox activity bounced back in the week of August 17-23 compared to the prior week. In Washington, the number of times RMLS™ subscribers opened Supra lockboxes increased 4.1% and in Oregon activity was up 1.4%.

Click the chart for a larger view (Washington, top; Oregon, bottom)
Archive
View an archive of the Supra lockbox statistical reports on Flickr.
by RMLS Communication Department | Aug 24, 2009 | Lockbox, Oregon Real Estate, Statistics, Washington Real Estate
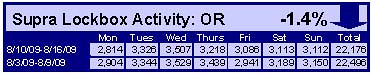
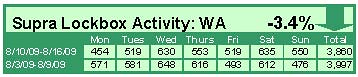
Lockbox activity down slightly
After an increase last week, lockbox activity dipped slightly in the week of August 10-16 compared to the prior week. In Washington, the number of times RMLS™ subscribers opened Supra lockboxes decreased 3.4% and in Oregon activity was down 1.4%.

Click the chart for a larger view (Washington, top; Oregon, bottom)
Archive
View an archive of the Supra lockbox statistical reports on Flickr.

by RMLS Communication Department | Aug 24, 2009 | Homeownership, Market Trends, Oregon Real Estate, Portland, Statistics
There’s been some encouraging news lately in the RMLS™ market areas. The number of sales and pending sales are finally outpacing the totals from the same month in 2008. How much of it might be a result of the $8,000 first-time homebuyer tax credit, though?
I recently put together some statistics for the Oregonian on the Portland metro area, and thought I would share them with you.
There is no question that home sales in the lower-end of the market have seen a big jump this year. In 2007, homes priced between $0 and $249,999 only made up 35% of all sales in the Portland metro area. In 2009 so far, they make up 49.6% of the market.
As you’d expect, coinciding with the increase in lower-end homes is a drop in high-end homes. Homes priced $500,000 or above have dropped from 13.5% of the market in 2007, to just 8.2% of the market this year.

Click on the graph for a larger view
The question is: what will happen when the $8,000 tax credit expires on December 1?
I know the tax credit definitely got me off the fence & I can literally think of 15 of my friends and acquaintances (off the top of my head) who have bought or are actively looking to buy.
So in my humble opinion, there’s little doubt that the tax credit spurred people to buy. But as the deadline for the credit approaches, it should be interesting to see where sales go.