by RMLS Communication Department | Aug 17, 2009 | Lockbox, Statistics
Lockbox activity rebounds
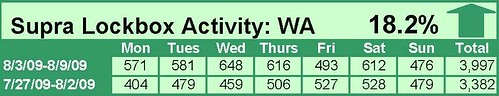
After a few down weeks, lockbox activity rebounded in the week of August 3-9 compared to the prior week. In Washington, the number of times RMLS™ subscribers opened Supra lockboxes increased 18.2% and in Oregon, activity was up 8.8%.

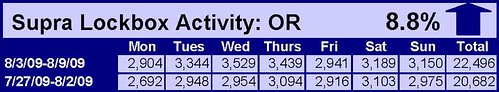
Click the chart for a larger view (Washington, top; Oregon, bottom)
Archive
View an archive of the Supra lockbox statistical reports on Flickr.

by RMLS Communication Department | Aug 13, 2009 | Clark County, Coos County, Curry County, Douglas County, Lane County, Market Trends, Oregon Real Estate, Portland, Statistics, Union County, Washington Real Estate
We released the latest Market Action reports to RMLS™ subscribers yesterday. Many areas of Oregon and Southwest Washington are showing improvement as far as sales and inventory go – here are a few highlights:

Portland Metro Active Listings: Note how the 2009 line is basically flat.
Inventory: Inventory is showing steady improvement in Portland (7.3 months), Clark County (7.3 months), and Lane County (6.2 months). In most circles, 6 months of supply is considered a balanced market. The drop in inventory comes thanks to strong closed sales, but also because the number of active listings is growing at a much slower pace than usual.
Closed sales: The Portland metro area was finally able to post a gain in same-month closed sales for the first time since April 2007. Closed sales were up 8.6% compared to last July. Clark County posted a gain for the second straight month – closed sales were up 23.5% there. Lane County also posted an 11% gain. Baker County, Curry County, Douglas County, and the Mid-Columbia region also saw growth.

Clark Co. Pending Sales: Oh, so close to reaching July 2007 levels.
Pending sales: Same-month pending sales in Clark County grew for the fourth month in a row at 30.3%. In fact, Clark County pending sales not only surpassed July 2008 levels, but they came close to hitting July 2007 levels. With the exception of the Mid-Columbia region and Union County, same-month pending sales grew in all of our primary service areas.
by RMLS Communication Department | Aug 10, 2009 | Lockbox, Statistics
Downward trend continues
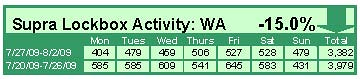
Comparing July 20, 2009 through August 2, 2009 the number of times RMLS™ subscribers opened Supra lockboxes decreased 15% in Washington and 5.4% in Oregon.
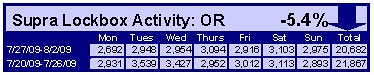

Click the chart for a larger view (Oregon, left; Washington, right)
Archive
View an archive of the Supra lockbox statistical reports on Flickr.
by RMLS Communication Department | Aug 3, 2009 | Lockbox, Market Trends, Oregon Real Estate, Statistics, Washington Real Estate
Activity continues to slide, slightly
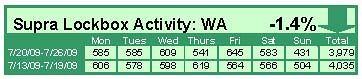
Comparing July 13, 2009 through July 26, 2009 the number of times RMLS™ subscribers opened Supra lockboxes decreased 1.4% in Washington and 1.9% in Oregon.


Click the chart for a larger view (Oregon, top; Washington, bottom)
Archive
View an archive of the Supra lockbox statistical reports on Flickr.
by RMLS Communication Department | Jul 27, 2009 | Lockbox, Market Trends, Oregon Real Estate, Statistics, Washington Real Estate
Activity down over previous week
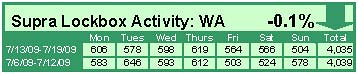
Comparing July 6, 2009 through July 19, 2009 the number of times RMLS™ subscribers opened Supra lockboxes decreased 0.1% in Washington and 3.9% in Oregon.
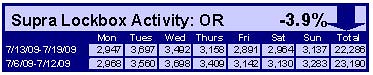

Click the chart for a larger view (Oregon, left; Washington, right)
Archive
View an archive of the Supra lockbox statistical reports on Flickr.
by RMLS Communication Department | Jul 23, 2009 | Market Trends, RMLS News, Statistics
Lots of people are talking about short sales and foreclosures these days. If you didn’t know better, you might think that they’re the dominant type of listing for sale. But fortunately, you do know better and starting next week when we add two new short sale fields to RMLSweb (more on that later) it’s going to be even easier for you to keep tabs on these distressed properties.
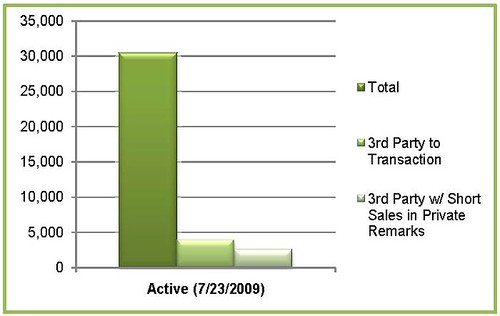
The graph below shows you the total number of active listings in RMLSweb as of today, July 23, 2009, compared with the number of active listings that are checked 3rd Party to Transaction Yes – approximately 12.8%.

(Since 3rd Party to Transaction doesn’t necessarily mean it’s a short sale – it could also be an estate sale or relo property, for example – I’ve also included the number of 3rd Party to Transaction that mention short sale in the Private Remarks.)
The next logical question is how well are these properties selling? To help answer that here’s another chart that shows the number of listings marked 3rd Party to Transaction Yes that are currently active , currently pending and that sold in the first half of the year.

As I mentioned earlier, 3rd Party to Transaction Yes does not necessarily mean a listing is a short sale. Therefore, to handle short sales more efficiently and to help the other types of properties that require 3rd Party approval to get fair attention, the RMLS™ Board of directors voted to add the following fields to RMLSweb:
Short Sale Yes/No – will be required when entering a listing and 3rd Party to Transaction will be automatically checked when Yes is selected.
Short Sale Offer (Seller Accepted; Submitted for Approval) Yes/No – The rules will be revised to require updating this field when an offer is made.
For more information on short sales see the National Association of Realtors Field Guide to Short Sales.
P.S. Be sure to check back for statistics on Bank Owned properties to come soon.