by Christina Smestad | Jan 11, 2019 | Fun Facts, RMLSweb, Statistics
Here we go again! RMLS™ celebrates another year working hard for thousands of subscribers across Oregon and Southwest Washington by presenting an annual collection of numbers. These numbers show just how much RMLS™ has supported real estate activity over the course of 2018. We hope you enjoyed journeying along with us.
Compare the numbers below with the same from prior years and see how we’ve grown!
RMLSweb
Number of times subscribers logged in to RMLSweb: 1,662,042
Photos uploaded to listings: 1,981,602
Number of new prospect profiles created: 71,914
All residential properties listed for sale: 78,378
All residential properties sold: 57,902
Median sold price of homes listed: $350,000
Total dollar volume of homes sold: $22,455,096,000
Reports viewed: 8,286,339
RMLS™ Subscribers
RMLS™ subscribers as of December 2018: 14,489
New RMLS™ subscribers (compared to December 2017): 516
Increase in subscribers, above: +3.69
Subscribers who attended training: 5,406
Number of calls to the RMLS™ Help Desk: 27,794
Number of Help Desk chats: 5,215
Number of incidents reported using the “Report Issue” button: 7,027
CE hours distributed by RMLS™ at no cost to subscribers: 1,565
Total attendance at RMLS™ training events: 5,747
RMLS.com
Total customer visits to RMLS.com: 2,120,150
Unique visits: 791,455
Total listing views: 1,145,379
Social Media
RMLS™ followers on Facebook (December 31st): 4,289
RMLS™ followers on Twitter (December 31st): 2,937
RMLS™ regularly compiles plenty of other numbers as well! In addition to publishing Market Action each month, we have statistical summaries available on RMLSweb with information dating back several years.
We love numbers here at RMLS™, and hope you find this data as fun and interesting as we do.

by Heather Andrews | Jan 7, 2019 | Lockbox, Statistics
This Week’s Lockbox Activity
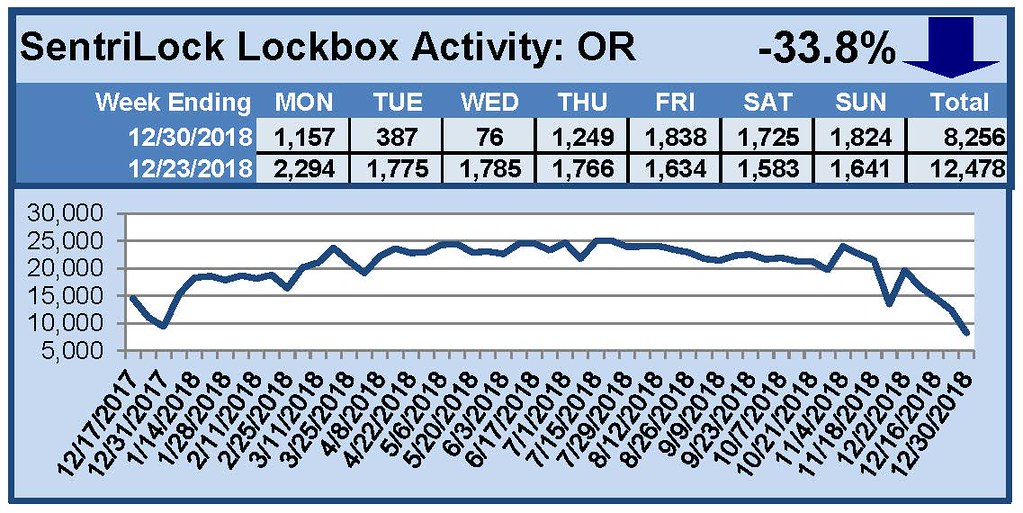
For the week of December 24-30, 2018, these charts show the number of times RMLS™ subscribers opened SentriLock lockboxes in Oregon and Washington. Oregon and Washington both saw decreased activity this week.
For a larger version of each chart, visit the RMLS™ photostream on Flickr.
by Heather Andrews | Dec 31, 2018 | Lockbox, Statistics
This Week’s Lockbox Activity
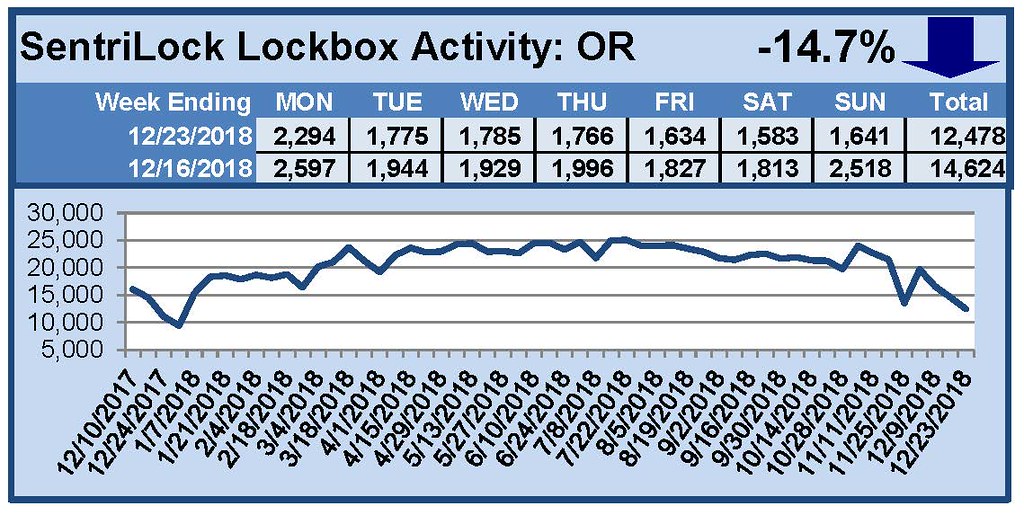
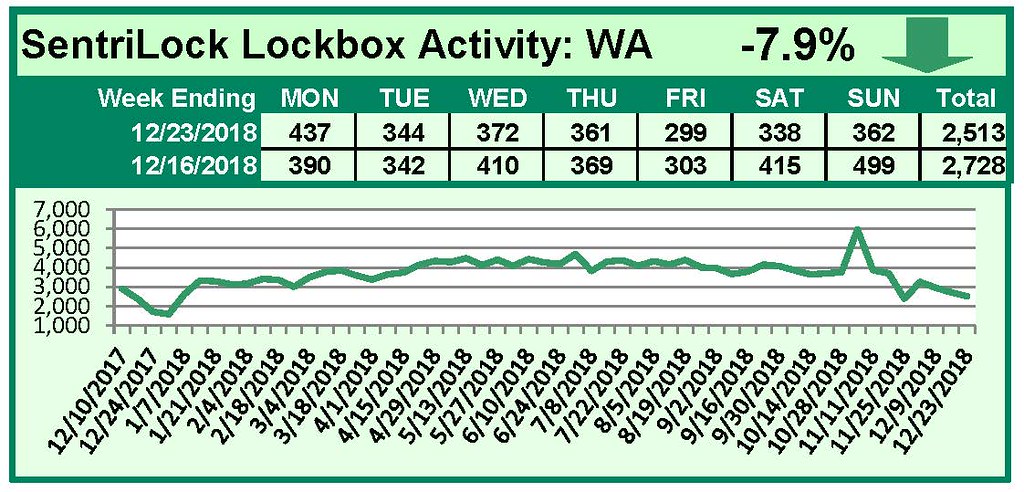
For the week of December 17-23, 2018, these charts show the number of times RMLS™ subscribers opened SentriLock lockboxes in Oregon and Washington. Oregon and Washington both saw activity decrease this week.
For a larger version of each chart, visit the RMLS™ photostream on Flickr.
by Heather Andrews | Dec 24, 2018 | Lockbox, Statistics
This Week’s Lockbox Activity
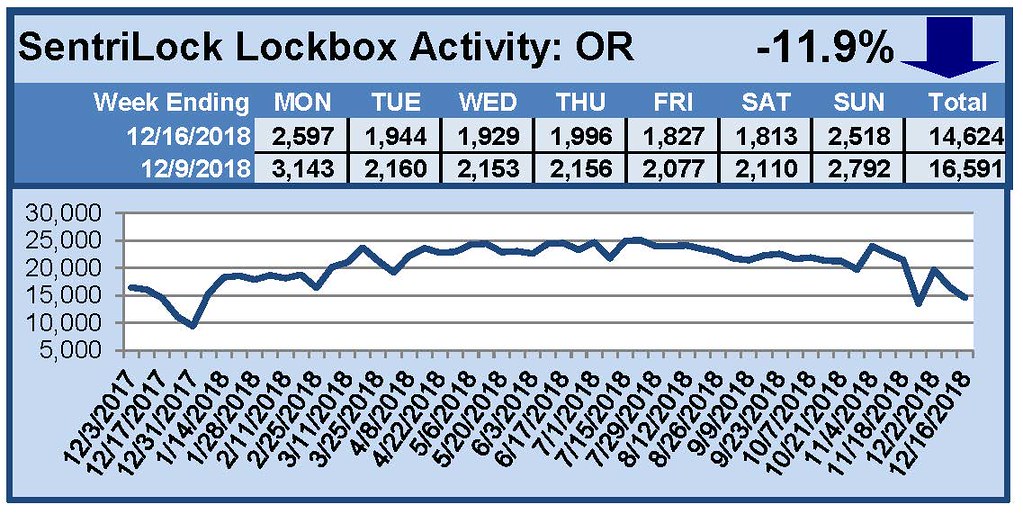
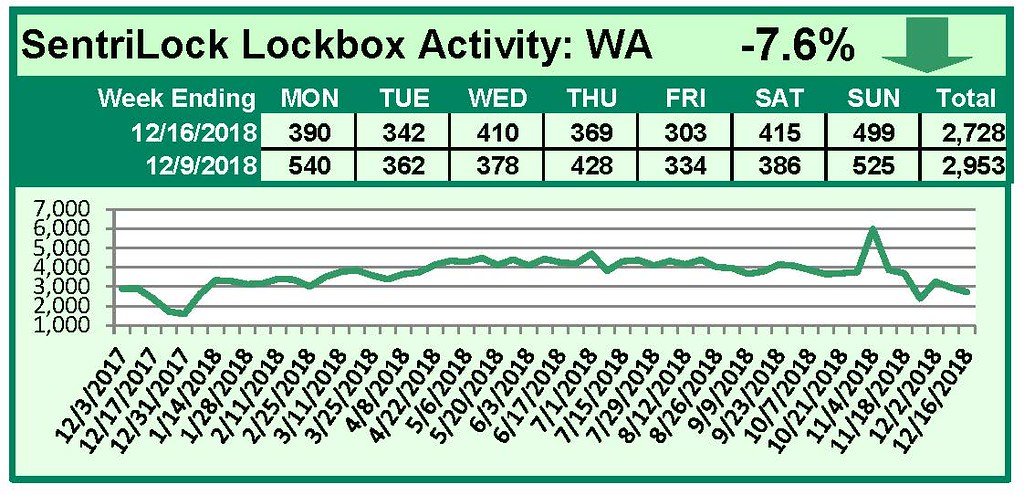
For the week of December 10-16, 2018, these charts show the number of times RMLS™ subscribers opened SentriLock lockboxes in Oregon and Washington. Oregon and Washington both saw activity decrease this week.
For a larger version of each chart, visit the RMLS™ photostream on Flickr.
by Heather Andrews | Dec 10, 2018 | Lockbox, Statistics

This Week’s Lockbox Activity
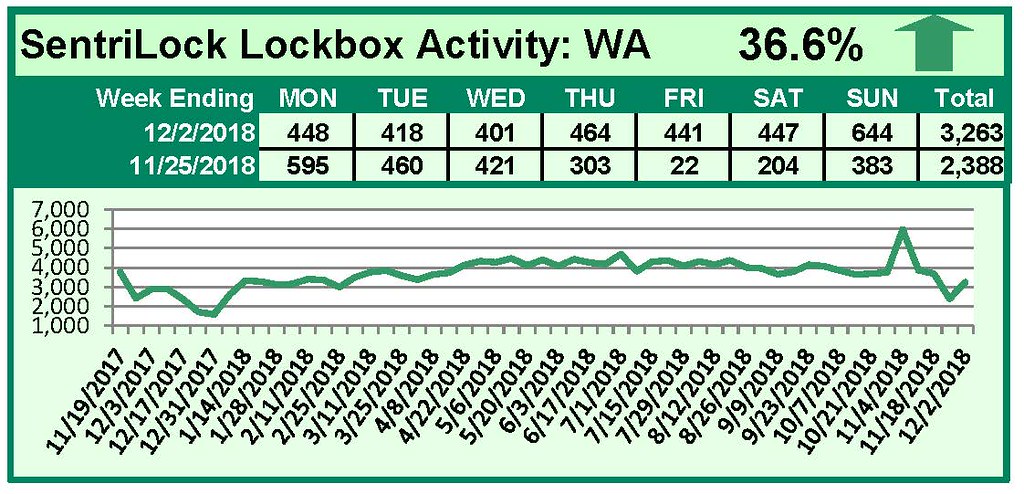
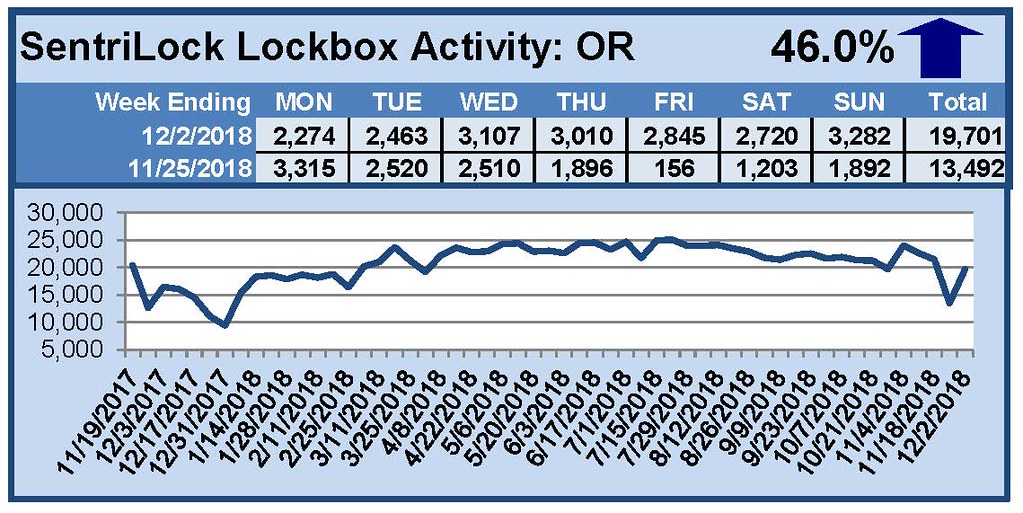
For the week of November 26-December 2, 2018, these charts show the number of times RMLS™ subscribers opened SentriLock lockboxes in Oregon and Washington. Activity increased sharply in both Oregon and Washington again this week.
For a larger version of each chart, visit the RMLS™ photostream on Flickr.
by Heather Andrews | Dec 3, 2018 | Lockbox, Statistics

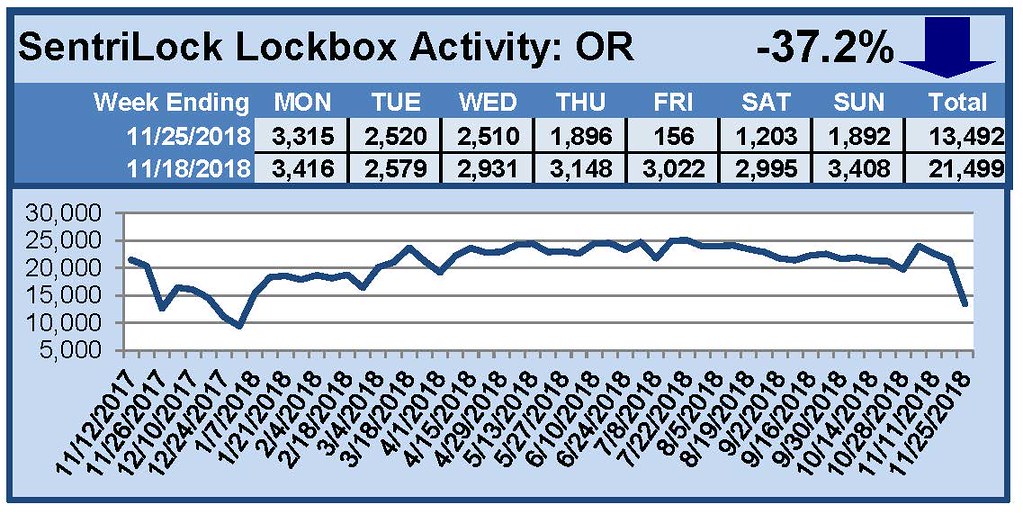
This Week’s Lockbox Activity
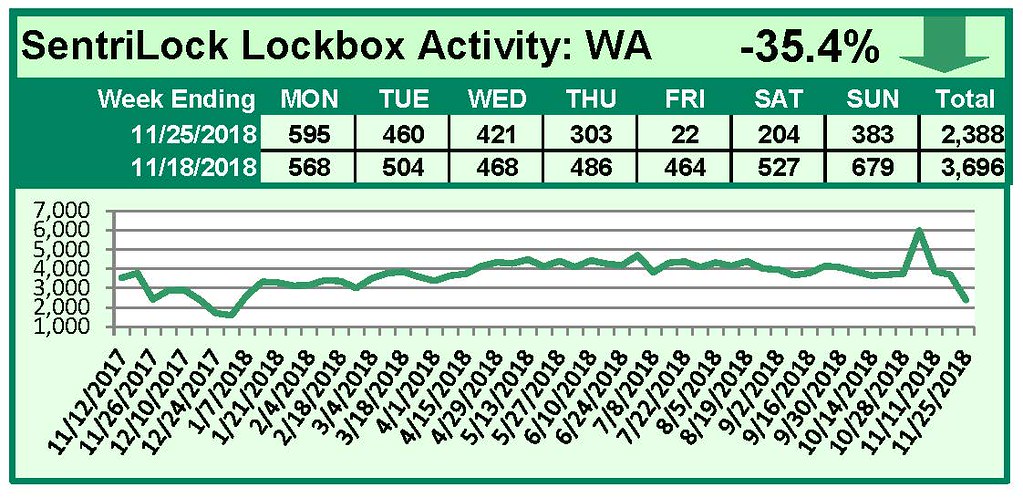
For the week of November 19-25, 2018, these charts show the number of times RMLS™ subscribers opened SentriLock lockboxes in Oregon and Washington. Activity decreased sharply in both Oregon and Washington this week.
For a larger version of each chart, visit the RMLS™ photostream on Flickr.

