by RMLS Communication Department | Feb 4, 2015 | Fun Facts, RMLSweb, Statistics
How much work does RMLS™ do for thousands of subscribers across Oregon and Southwest Washington? This is the second year we’ve compiled numbers to show just how much RMLS™ has supported real estate activity over the course of a single year (read RMLS™ by the Numbers 2013).
RMLSweb
Number of times subscribers logged in to RMLSweb: 1,475,802
Photos uploaded to listings: 1,138,099
Property searches run: 513,354
Number of new prospect profiles created: 63,943
All residential properties listed for sale: 69,541
All residential properties sold: 48,052
Median sold price of homes listed: $251,000
Total dollar volume of homes sold: $14,067,725,000
Unique tax searches: 107,750
Reports viewed: 9,301,407
Broker tour searches run: 12,876
Open house searches run: 8,364
Statistical searches run: 26,926
RMLS™ Subscribers
RMLS™ subscribers as of December 2014: 11,279
New RMLS™ subscribers (compared to December 2013): 603
Increase in subscribers, above: +5.7%
Subscribers who attended training: 3,047
Number of calls to the RMLS™ Help Desk: 22,978
Number of Help Desk chats: 3,012
Number of incidents reported using the “Report Issue” button: 5,299
CE hours distributed by RMLS™ at no cost to subscribers: 4,260
Total attendance at RMLS™ training events: 4,800
RMLS.com
Total customer visits to RMLS.com: 3,375,870
Unique visits: 1,082,046
Total listing views: 2,299,823
Social Media
RMLS™ followers on Facebook (December 31st): 2,930
RMLS™ followers on Twitter (December 31st): 2,358
Don’t forget about the other numbers we regularly compile! In addition to publishing Market Action each month, we have statistical summaries available on RMLSweb with information dating back several years. Since 2012 we’ve also been compiling statistics about residential distressed properties in RMLSweb.
We love numbers here at RMLS™, and hope you find this data as fun and interesting as we do.
by Christina Smestad | Feb 4, 2015 | Fun Facts, RMLSweb, Statistics
How much work does RMLS™ do for thousands of subscribers across Oregon and Southwest Washington? This is the second year we’ve compiled numbers to show just how much RMLS™ has supported real estate activity over the course of a single year (read RMLS™ by the Numbers 2013).
RMLSweb
Number of times subscribers logged in to RMLSweb: 1,475,802
Photos uploaded to listings: 1,138,099
Property searches run: 513,354
Number of new prospect profiles created: 63,943
All residential properties listed for sale: 69,541
All residential properties sold: 48,052
Median sold price of homes listed: $251,000
Total dollar volume of homes sold: $14,067,725,000
Unique tax searches: 107,750
Reports viewed: 9,301,407
Broker tour searches run: 12,876
Open house searches run: 8,364
Statistical searches run: 26,926
RMLS™ Subscribers
RMLS™ subscribers as of December 2014: 11,279
New RMLS™ subscribers (compared to December 2013): 603
Increase in subscribers, above: +5.7%
Subscribers who attended training: 3,047
Number of calls to the RMLS™ Help Desk: 22,978
Number of Help Desk chats: 3,012
Number of incidents reported using the “Report Issue” button: 5,299
CE hours distributed by RMLS™ at no cost to subscribers: 4,260
Total attendance at RMLS™ training events: 4,800
RMLS.com
Total customer visits to RMLS.com: 3,375,870
Unique visits: 1,082,046
Total listing views: 2,299,823
Social Media
RMLS™ followers on Facebook (December 31st): 2,930
RMLS™ followers on Twitter (December 31st): 2,358
Don’t forget about the other numbers we regularly compile! In addition to publishing Market Action each month, we have statistical summaries available on RMLSweb with information dating back several years. Since 2012 we’ve also been compiling statistics about residential distressed properties in RMLSweb.
We love numbers here at RMLS™, and hope you find this data as fun and interesting as we do.
by RMLS Communication Department | Feb 2, 2015 | Lockbox, Statistics
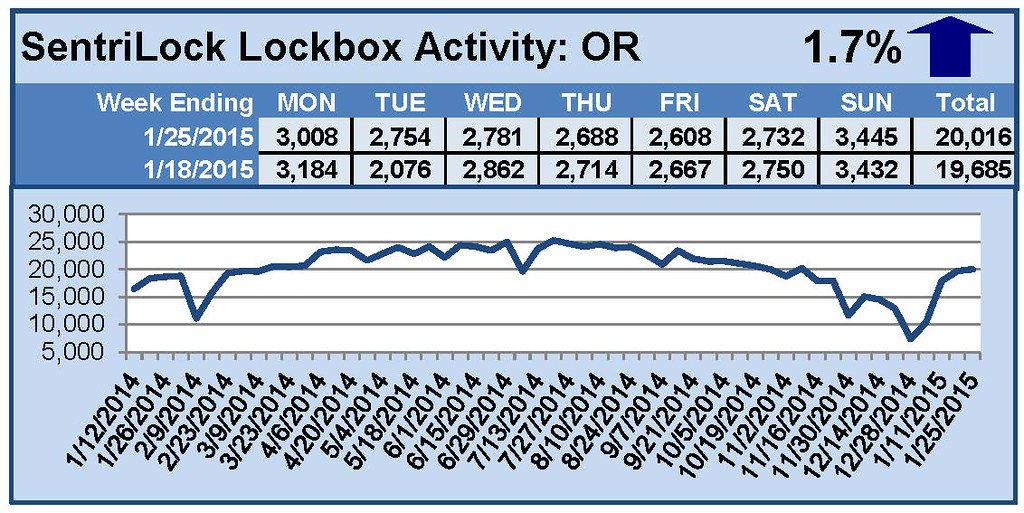
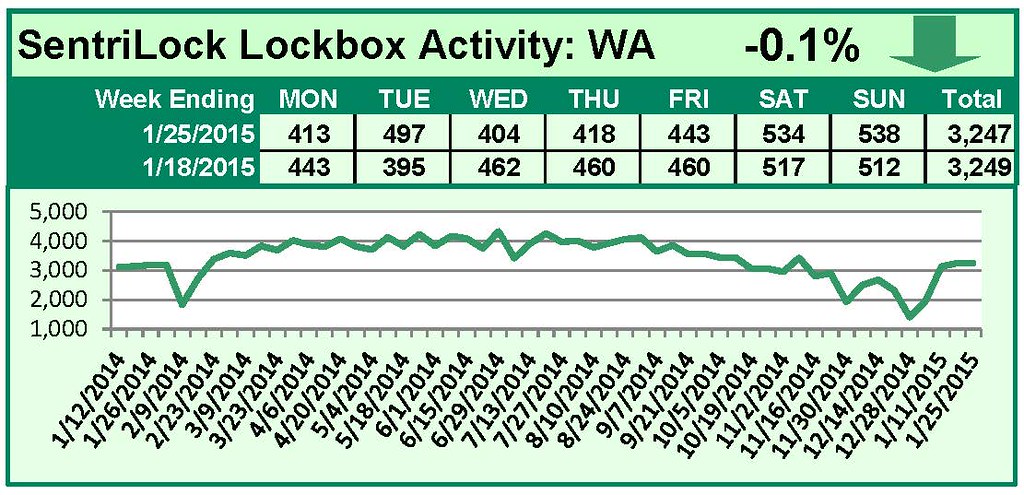
This Week’s Lockbox Activity
For the week of January 19-25, 2015, these charts show the number of times RMLS™ subscribers opened SentriLock lockboxes in Oregon and Washington. Activity in Oregon increased this week, and activity in Washington fell slightly.
For a larger version of each chart, visit the RMLS™ photostream on Flickr.
by RMLS Communication Department | Jan 26, 2015 | Lockbox, Statistics

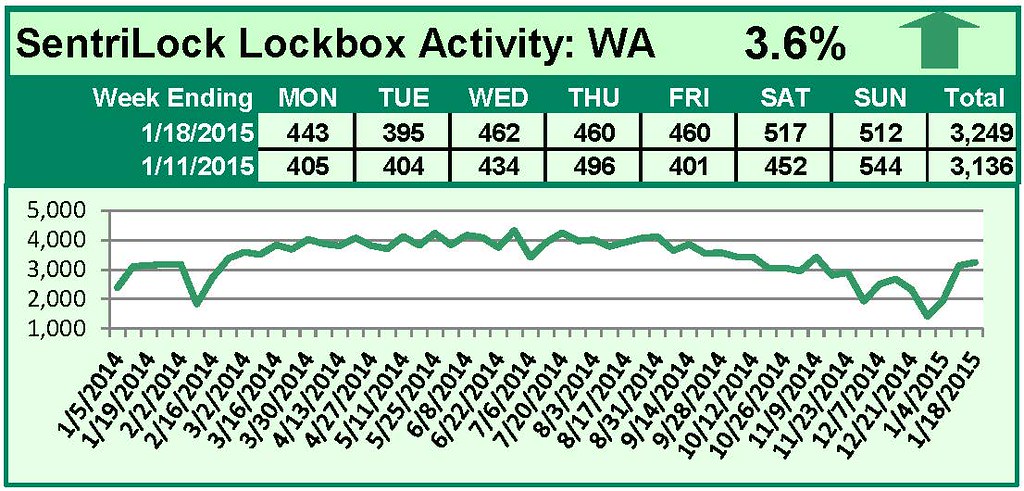
This Week’s Lockbox Activity
For the week of January 12-18, 2015, these charts show the number of times RMLS™ subscribers opened SentriLock lockboxes in Oregon and Washington. Washington and Oregon both saw an increase in activity this week.
For a larger version of each chart, visit the RMLS™ photostream on Flickr.
![2014 Distressed Residential Properties]()
by RMLS Communication Department | Jan 22, 2015 | Distressed Properties, Statistics
The chart below shows the number of bank owned/REO and short sales in all areas of the RMLS™ system during 2014.
 All areas when comparing percentage share of the market 2013 to 2014:
• Comparing 2013 to 2014, distressed sales as a percentage of closed sales decreased from 15.1% to 10.4%.
• New listings increased from 65,206 to 68,291, which is a 4.7% increase.
• Short sales comprised 3.3% of new listings and 4.1% of sold listings in 2014, down 3.1% and 4.0% from 2013 respectively as a percentage of the market.
• Bank owned/REO properties comprised 5.2% of new listings and 6.3% of sales in 2014, increasing from 4.5% and decreasing from 7.0%, respectively, in 2013.
Portland metro when comparing percentage share of the market 2013 to 2014:
• Comparing 2013 to 2014, distressed sales as a percentage of closed sales decreased from 13.2% to 8.6%.
• New listings rose from 35,524 to 37,283, which is a 4.9% increase.
• Short sales comprised 3.3% of new listings and 3.9% of sold listings in 2014, down 3.1% and 4.1% from 2013 respectively as a percentage of the market.
• Bank owned/REO properties comprised 4.2% of new listings and 4.7% of sales in 2014, increasing from 3.3% and decreasing from 5.2%, respectively, in 2013.
Clark County when comparing percentage share of the market 2013 to 2014:
• Comparing 2013 to 2014, distressed sales as a percentage of closed sales decreased from 22.4% to 14.6%.
• New listings rose from 9,079 to 9,607, which is a 5.8% increase.
• Short sales comprised 4.7% of new listings and 6.2% of sold listings in 2014, down 5.3% and 6.5% from 2013 as a percentage of the market.
• Bank owned/REO properties comprised 5.8% of new listings and 8.4% of sales in 2014, decreasing from 7.8% and 9.7% respectively in 2013.
Below are links to additional charts for some of our larger areas:
Portland Metro Area
Clark County, WA
Lane County, OR
Douglas County, OR
Coos County, OR
If you want information on percentages of distressed sales in other areas not represented by our charts, please contact us at communications@rmls.com.