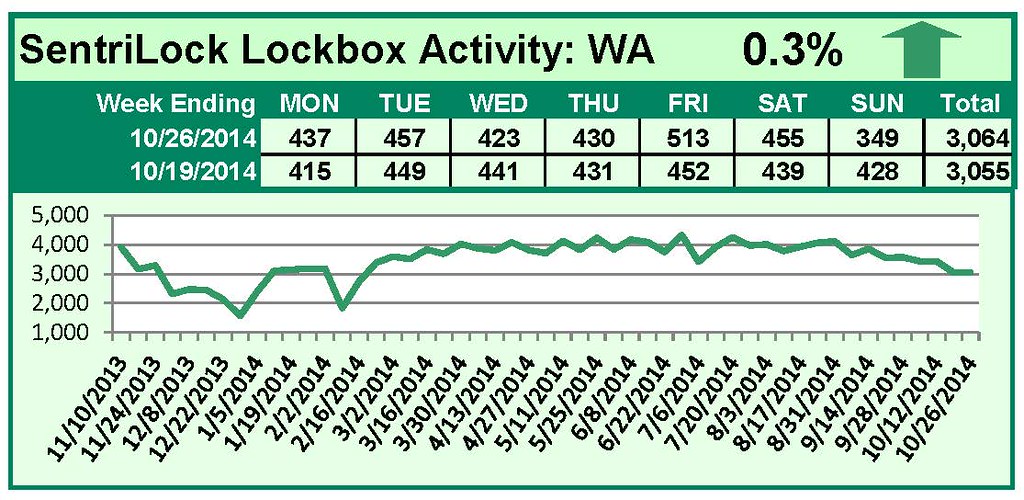
by RMLS Communication Department | Nov 3, 2014 | Lockbox, Statistics
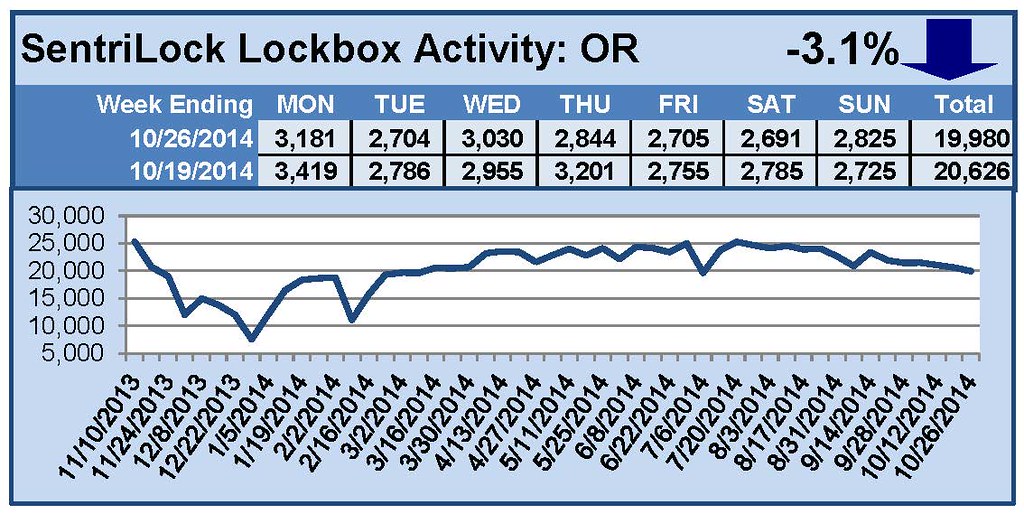
This Week’s Lockbox Activity
For the week of October 20-26, 2014, these charts show the number of times RMLS™ subscribers opened SentriLock lockboxes in Oregon and Washington. Activity in Oregon fell this week, while activity in Washington rose slightly.
For a larger version of each chart, visit the RMLS™ photostream on Flickr.
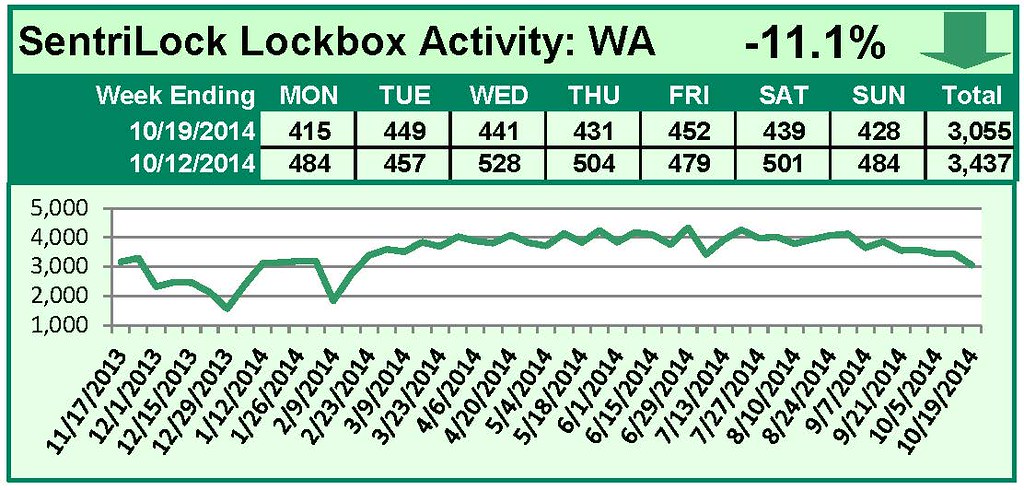
by RMLS Communication Department | Oct 27, 2014 | Lockbox, Statistics
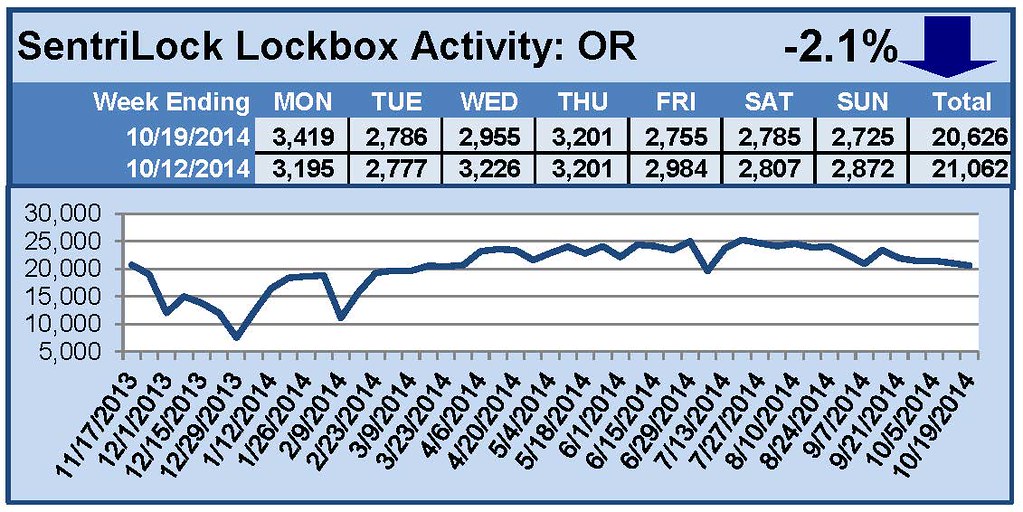
This Week’s Lockbox Activity
For the week of October 13-19, 2014, these charts show the number of times RMLS™ subscribers opened SentriLock lockboxes in Oregon and Washington. Washington and Oregon both saw a decrease in activity this week.
For a larger version of each chart, visit the RMLS™ photostream on Flickr.
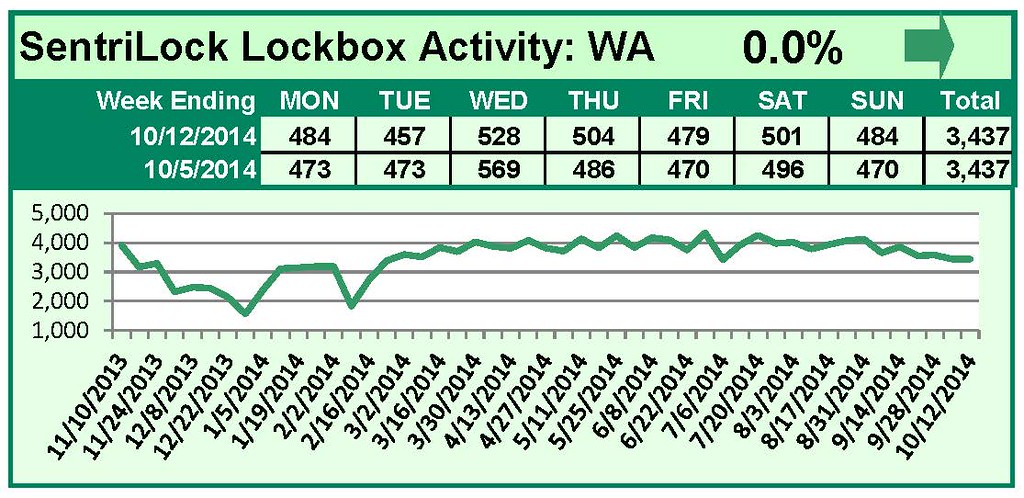
by RMLS Communication Department | Oct 20, 2014 | Lockbox, Statistics
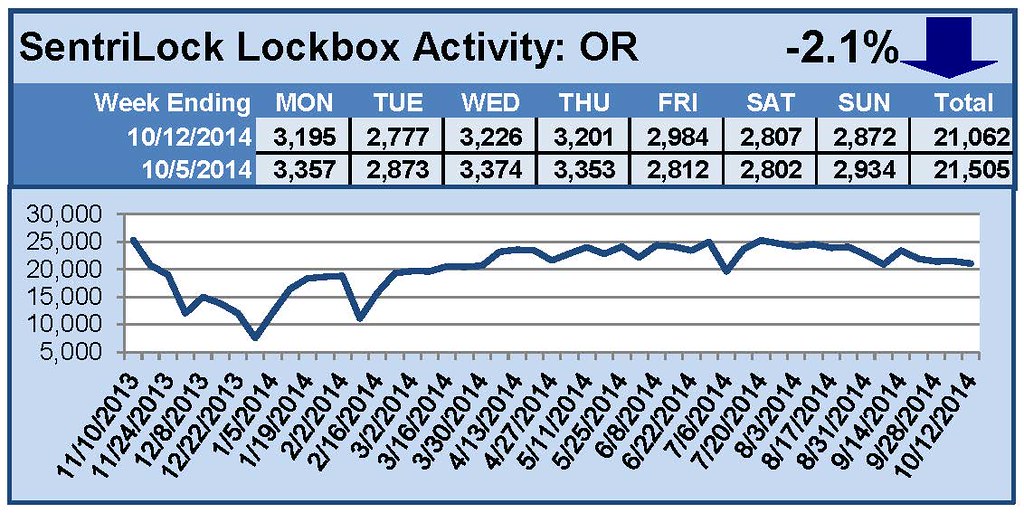
This Week’s Lockbox Activity
For the week of October 6-12, 2014, these charts show the number of times RMLS™ subscribers opened SentriLock lockboxes in Oregon and Washington. Activity in Washington held steady while Oregon saw a decrease in showings this week.
For a larger version of each chart, visit the RMLS™ photostream on Flickr.
![Residential Distressed Properties for Third Quarter (July-September) 2014]()
by RMLS Communication Department | Oct 16, 2014 | Distressed Properties, Industry News, Market Trends, Statistics
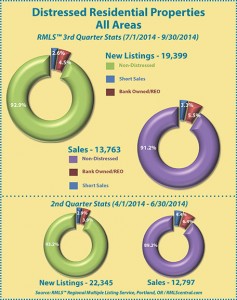
This chart shows the number of bank owned/REO properties and short sales in all areas of the RMLS™ system during the third quarter of 2014.
Below are links to additional charts for some of our larger areas.
• Portland Metro Distressed Properties (3rd Quarter 2014)
• Clark County, WA Distressed Properties (3rd Quarter 2014)
• Lane County, OR Distressed Properties (3rd Quarter 2014)
• Douglas County, OR Distressed Properties (3rd Quarter 2014)
• Coos County, OR Distressed Properties (3rd Quarter 2014)
Here are some additional facts about distressed residential properties in the third quarter of 2014:
All areas when comparing percentage share of the market, third quarter 2014 to second quarter 2014:
• When comparing the third quarter 2014 to second quarter 2014, distressed sales as a percentage of new listings increased by 0.3% (7.1 v. 6.8%).
• In a comparison of the third quarter 2014 to second quarter 2014, distressed sales as a percentage of closed sales decreased by 2.0% (8.8 vs. 10.8%).
• Short sales comprised 2.6% of new listings and 3.3% of sales in the third quarter of 2014, down 0.3% and 1.1% from the second quarter of 2014, respectively.
• Bank owned/REO properties comprised 4.5% of new listings and 5.5% of sales in the third quarter of 2014, up 0.6% and down 0.9% from the second quarter of 2014, respectively.
Portland metro when comparing percentage share of the market, third quarter 2014 to second quarter 2014:
• When comparing the third quarter 2014 to second quarter 2014, distressed sales as a percentage of new listings increased by 0.1% (6.2 vs. 6.1%).
• In a comparison of third quarter 2014 to second quarter 2014, distressed sales as a percentage of closed sales decreased by 1.6% (7.2 v. 8.8%).
• Short sales comprised 2.6% of new listings and 3.3% of sales in the third quarter of 2014, down 0.4% and 0.8% from the second quarter of 2014, respectively.
• Bank owned/REO properties comprised 3.6% of new listings and 3.9% of sales in the third quarter of 2014, up 0.5% and down 0.8% from the second quarter of 2014, respectively.
Clark County when comparing percentage share of the market, third quarter 2014 to second quarter 2014:
• When comparing the third quarter 2014 to second quarter 2014, distressed sales as a percentage of new listings decreased by 0.6% (8.8 v. 9.4%).
• In a comparison of third quarter 2014 to second quarter 2014, distressed sales as a percentage of closed sales decreased by 4.7% (11.1 v. 15.8%).
• Short sales comprised 3.8% of new listings and 4.7% of sales in the third quarter of 2014, down 0.9% for new listings and 2.0% for sales when compared to the second quarter of 2014, respectively.
• Bank owned/REO properties comprised 5.0% of new listings and 6.4% of sales in the third quarter of 2014, up 0.3% and down 2.7% from the second quarter of 2014, respectively.
If you’d like more information or percentages of distressed residential sales in other areas not represented by our charts, please contact us at communications@rmls.com.
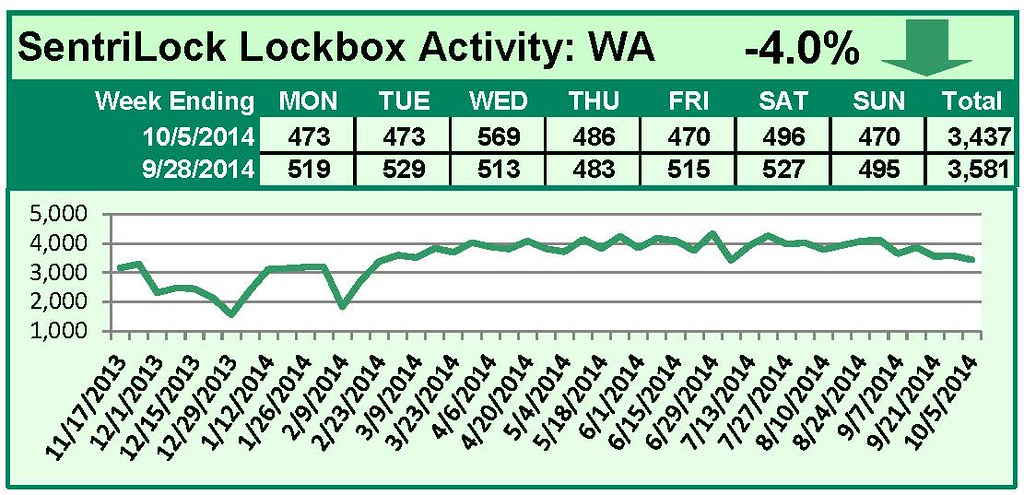
by RMLS Communication Department | Oct 13, 2014 | Lockbox, Statistics
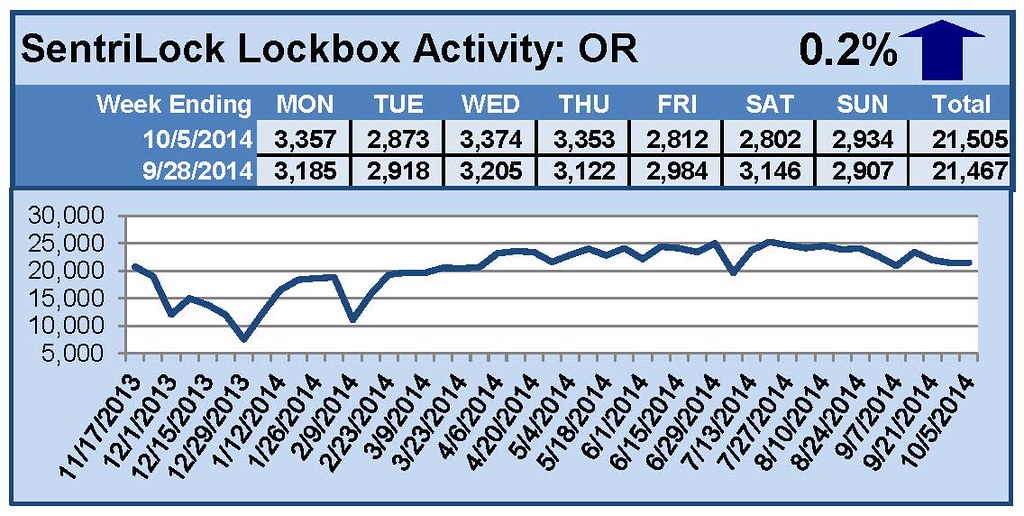
This Week’s Lockbox Activity
For the week of September 29-October 5, 2014, these charts show the number of times RMLS™ subscribers opened SentriLock lockboxes in Oregon and Washington. Activity fell this week in Washington, but rose slightly in Oregon.
For a larger version of each chart, visit the RMLS™ photostream on Flickr.
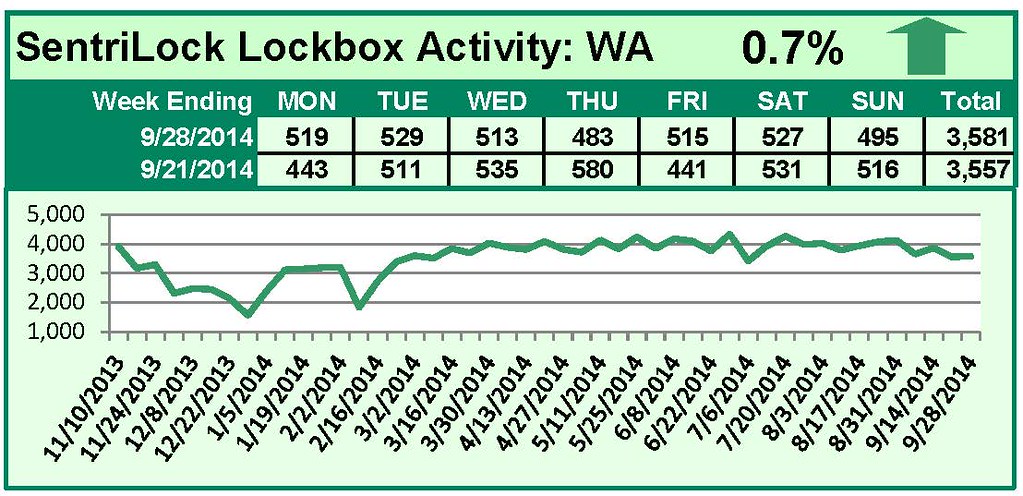
by RMLS Communication Department | Oct 6, 2014 | Lockbox, Statistics

This Week’s Lockbox Activity
For the week of September 22-28, 2014, these charts show the number of times RMLS™ subscribers opened SentriLock lockboxes in Oregon and Washington. Washington saw activity rise this week, while Oregon saw lockbox activity decrease.
For a larger version of each chart, visit the RMLS™ photostream on Flickr.